File:Predator prey curve.png

Size of this preview: 800 × 404 pixels. Other resolutions: 320 × 162 pixels | 640 × 324 pixels | 1,440 × 728 pixels.
Original file (1,440 × 728 pixels, file size: 182 KB, MIME type: image/png)
Captions
Captions
Add a one-line explanation of what this file represents
Summary edit
| Description |
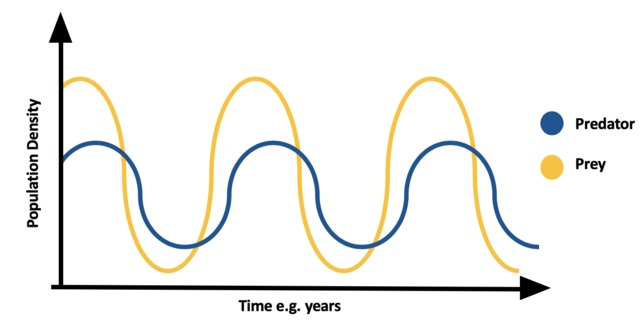
English: A generalised graph of a predator-prey population density cycle.
The blue curve represents the predator, the orange curve the prey. |
| Date | |
| Source | Own work |
| Author | Hczarn |
Licensing edit
I, the copyright holder of this work, hereby publish it under the following license:
This file is licensed under the Creative Commons Attribution-Share Alike 4.0 International license.
- You are free:
- to share – to copy, distribute and transmit the work
- to remix – to adapt the work
- Under the following conditions:
- attribution – You must give appropriate credit, provide a link to the license, and indicate if changes were made. You may do so in any reasonable manner, but not in any way that suggests the licensor endorses you or your use.
- share alike – If you remix, transform, or build upon the material, you must distribute your contributions under the same or compatible license as the original.
File history
Click on a date/time to view the file as it appeared at that time.
| Date/Time | Thumbnail | Dimensions | User | Comment | |
|---|---|---|---|---|---|
| current | 22:09, 16 March 2020 | | 1,440 × 728 (182 KB) | Hczarn (talk | contribs) | Curves better aligned |
| 16:27, 16 March 2020 |  | 1,596 × 800 (207 KB) | Hczarn (talk | contribs) | Cross-wiki upload from en.wikipedia.org |
You cannot overwrite this file.
File usage on Commons
There are no pages that use this file.
File usage on other wikis
The following other wikis use this file:
- Usage on en.wikipedia.org
- Usage on uk.wikipedia.org