File:Price history of silicon PV cells since 1977.svg

Size of this PNG preview of this SVG file: 673 × 599 pixels. Other resolutions: 270 × 240 pixels | 539 × 480 pixels | 863 × 768 pixels | 1,150 × 1,024 pixels | 2,301 × 2,048 pixels | 729 × 649 pixels.
Original file (SVG file, nominally 729 × 649 pixels, file size: 29 KB)
Captions
Captions
Add a one-line explanation of what this file represents
Summary edit
| Description | |
| Date |
W3C-validity not checked. This W3C-unspecified vector image was created with Inkscape . |
| Source |
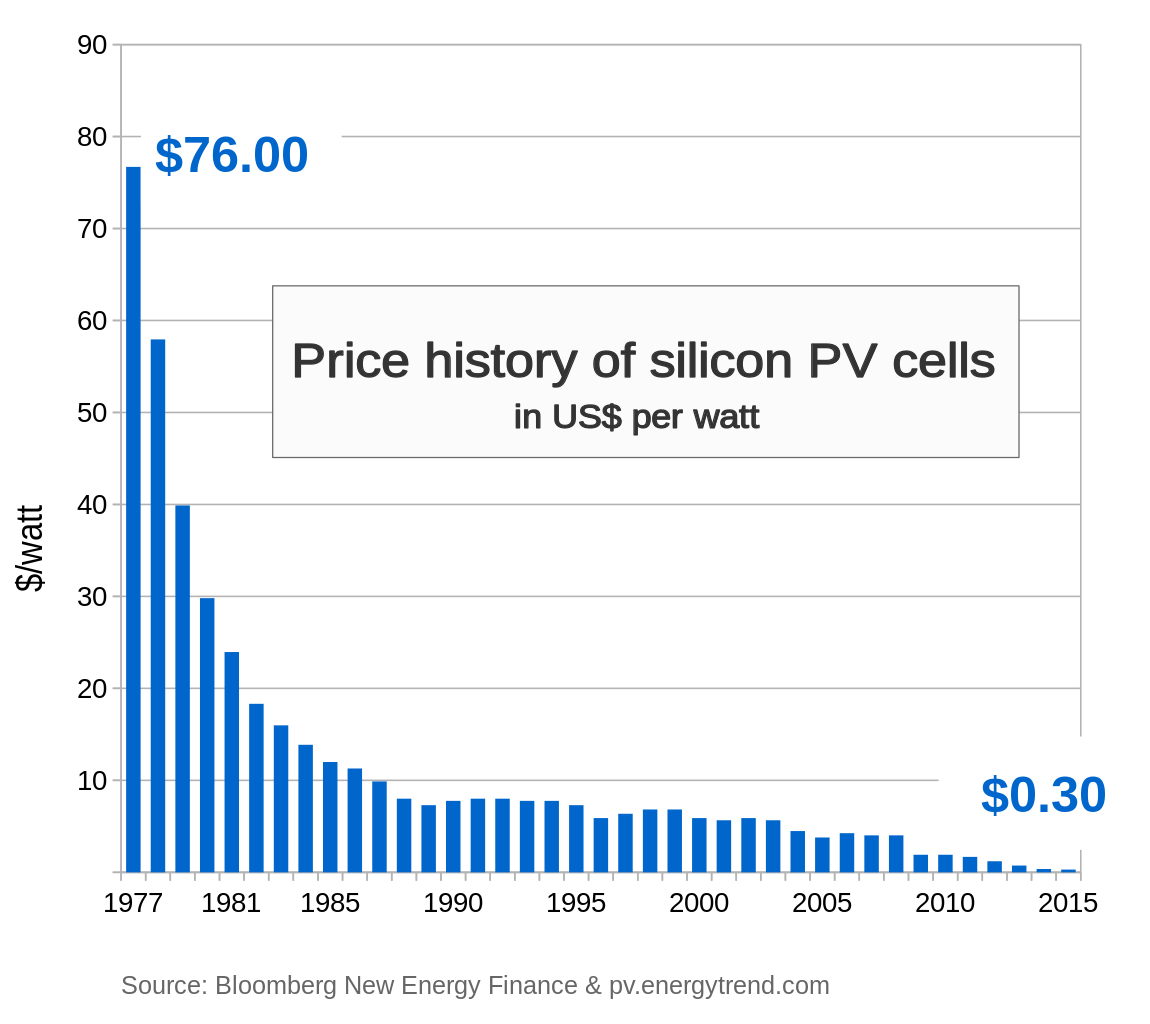
Own work, based on Hanjin's 2013-version (en español), amended with average sales prices for 2014 and 2015. Original source data
|
| Author | Rfassbind |
| Other versions |
|


Licensing edit
| I, the copyright holder of this work, release this work into the public domain. This applies worldwide. In some countries this may not be legally possible; if so: I grant anyone the right to use this work for any purpose, without any conditions, unless such conditions are required by law. |
File history
Click on a date/time to view the file as it appeared at that time.
| Date/Time | Thumbnail | Dimensions | User | Comment | |
|---|---|---|---|---|---|
| current | 02:28, 2 May 2015 | | 729 × 649 (29 KB) | Rfassbind (talk | contribs) | fix legend of y-axis |
| 02:18, 2 May 2015 |  | 729 × 649 (30 KB) | Rfassbind (talk | contribs) | revised layout - SVG valid version | |
| 22:23, 1 May 2015 |  | 720 × 519 (62 KB) | Rfassbind (talk | contribs) | updated chart, added ASP for 2015, changed from $0.36 to $0.30 | |
| 20:06, 26 June 2014 |  | 710 × 520 (60 KB) | Rfassbind (talk | contribs) | fixed offset in axis | |
| 17:26, 26 June 2014 |  | 710 × 520 (61 KB) | Rfassbind (talk | contribs) | {{Information |Description= Price history of c-Si photovoltaic cells, in $ per watt, since1977. |Source={{own}}, adapted from Hanjin's version (en español). Original source data [http://www.economist.com/news/21566414-alternative-ener... |
You cannot overwrite this file.
File usage on Commons
The following 3 pages use this file:
File usage on other wikis
The following other wikis use this file:
- Usage on ar.wikipedia.org
- Usage on bn.wikipedia.org
- Usage on en.wikipedia.org
- Usage on fr.wikipedia.org
- Usage on hr.wikipedia.org
- Usage on pl.wikipedia.org
- Usage on sw.wikipedia.org
- Usage on www.wikidata.org
- Usage on zh.wikipedia.org