File:Prisoner population rate world map.png
Size of this preview: 800 × 370 pixels. Other resolutions: 320 × 148 pixels | 640 × 296 pixels | 1,350 × 625 pixels.
Original file (1,350 × 625 pixels, file size: 20 KB, MIME type: image/png)
Captions
Captions
Add a one-line explanation of what this file represents
Summary edit
| Description |
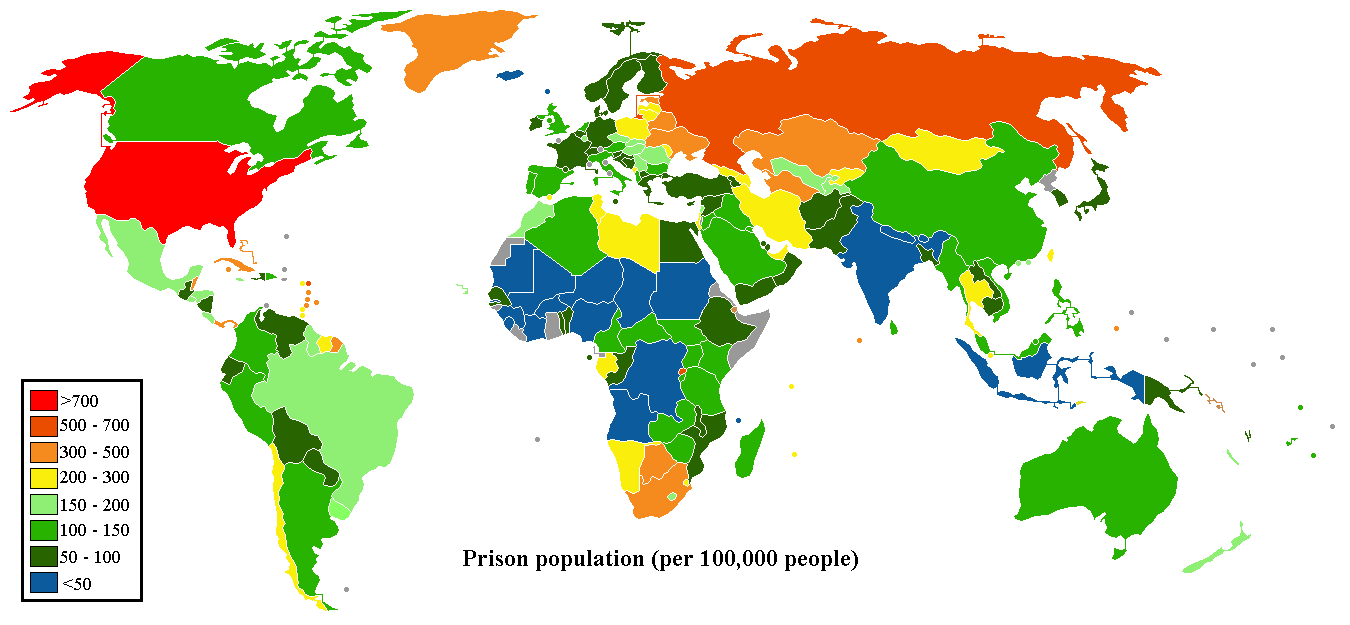
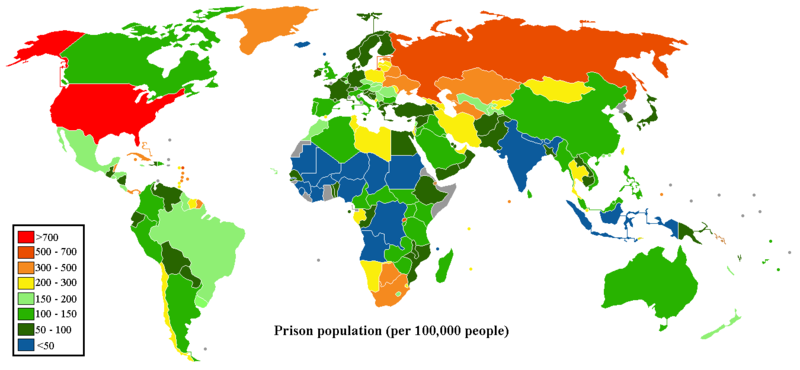
English: World map showing number of prisoners per 100,000 citizens (incarceration rate). Gray means no data. |
| Date | (when the latest version of the map was uploaded). This map needs to be updated at least once a year. |
| Source | Self-made. Data: Highest to Lowest - Prison Population Rate. The default order is highest to lowest. Click "title" column heading to sort the table in ascending or descending alphabetical order. Click "Prison Population Rate" heading to put in ascending or descending numerical order. For more details about the figures of any country, click on the name of that country. Main page: World Prison Brief. International Centre for Prison Studies. See this page for breakdowns by region, whole world, prison population total, prison population rate, percentage of pre-trial detainees / remand prisoners, percentage of female prisoners, percentage of foreign prisoners, and occupancy rate. See also: en:List of countries by incarceration rate. |
| Author | Sbw01f - first version of map. See upload history for latest co-creators. |
| Other versions |
|

|
File:Prisoner population rate world map.svg is a vector version of this file. It should be used in place of this PNG file when not inferior.
File:Prisoner population rate world map.png → File:Prisoner population rate world map.svg
For more information, see Help:SVG. |
 |
Licensing edit
I, the copyright holder of this work, hereby publish it under the following licenses:

|
Permission is granted to copy, distribute and/or modify this document under the terms of the GNU Free Documentation License, Version 1.2 or any later version published by the Free Software Foundation; with no Invariant Sections, no Front-Cover Texts, and no Back-Cover Texts. A copy of the license is included in the section entitled GNU Free Documentation License. |
This file is licensed under the Creative Commons Attribution 3.0 Unported license.
- You are free:
- to share – to copy, distribute and transmit the work
- to remix – to adapt the work
- Under the following conditions:
- attribution – You must give appropriate credit, provide a link to the license, and indicate if changes were made. You may do so in any reasonable manner, but not in any way that suggests the licensor endorses you or your use.
You may select the license of your choice.
File history
Click on a date/time to view the file as it appeared at that time.
| Date/Time | Thumbnail | Dimensions | User | Comment | |
|---|---|---|---|---|---|
| current | 02:54, 13 November 2012 | | 1,350 × 625 (20 KB) | JohnnyMrNinja (talk | contribs) | color indexed |
| 04:31, 6 May 2012 |  | 1,350 × 625 (53 KB) | Estartenf843h3er201105 (talk | contribs) | Add more information, including Taiwan | |
| 15:06, 22 March 2010 |  | 1,350 × 625 (34 KB) | Jan Hofmann (talk | contribs) | You can't put "neutrality" over readability and standards. A million other maps go from green to red. | |
| 18:30, 15 February 2009 |  | 1,350 × 625 (53 KB) | Dwrcan (talk | contribs) | Reverted to version as of 15:33, 19 May 2008 - Colours were meant to be neutral | |
| 19:41, 12 February 2009 |  | 1,350 × 625 (34 KB) | Renku~commonswiki (talk | contribs) | {{Information |Description={{en|World map showing number of prisoners per 100,000 citizens (incarceration rate). Gray means no data.}} |Source=*File:Prisoner_population_rate_UN_HDR_2007_2008.PNG |Date=2009-02-12 19:38 (UTC) |Auth | |
| 15:33, 19 May 2008 |  | 1,350 × 625 (53 KB) | Dwrcan (talk | contribs) | ||
| 22:25, 24 March 2008 |  | 1,350 × 625 (51 KB) | Dwrcan (talk | contribs) | {{Information |Description=World map showing prisoners per 100,000 people, gray = no data |Source=self-made, data from UN Human development report 2007/2008 [http://hdrstats.undp.org/indicators/265.html] |Date=March 2008 |Author= Sbw01f |P |
You cannot overwrite this file.
File usage on Commons
The following 4 pages use this file:
File usage on other wikis
The following other wikis use this file:
- Usage on ar.wikipedia.org
- Usage on de.wikipedia.org
- Usage on en.wikipedia.org
- Usage on sv.wikipedia.org