File:ProvincialGDPofPRC.png
Size of this preview: 800 × 580 pixels. Other resolutions: 320 × 232 pixels | 640 × 464 pixels | 1,024 × 743 pixels | 1,280 × 929 pixels | 2,560 × 1,858 pixels | 6,804 × 4,937 pixels.
Original file (6,804 × 4,937 pixels, file size: 481 KB, MIME type: image/png)
Captions
Captions
Add a one-line explanation of what this file represents


|
This image is expected to always be the most recent one. Feel free to update it when needed.
|

|
This file may be updated to reflect new information. If you wish to use a specific version of the file without new updates being mirrored, please upload the required version as a separate file. |
Summary edit
| Description |
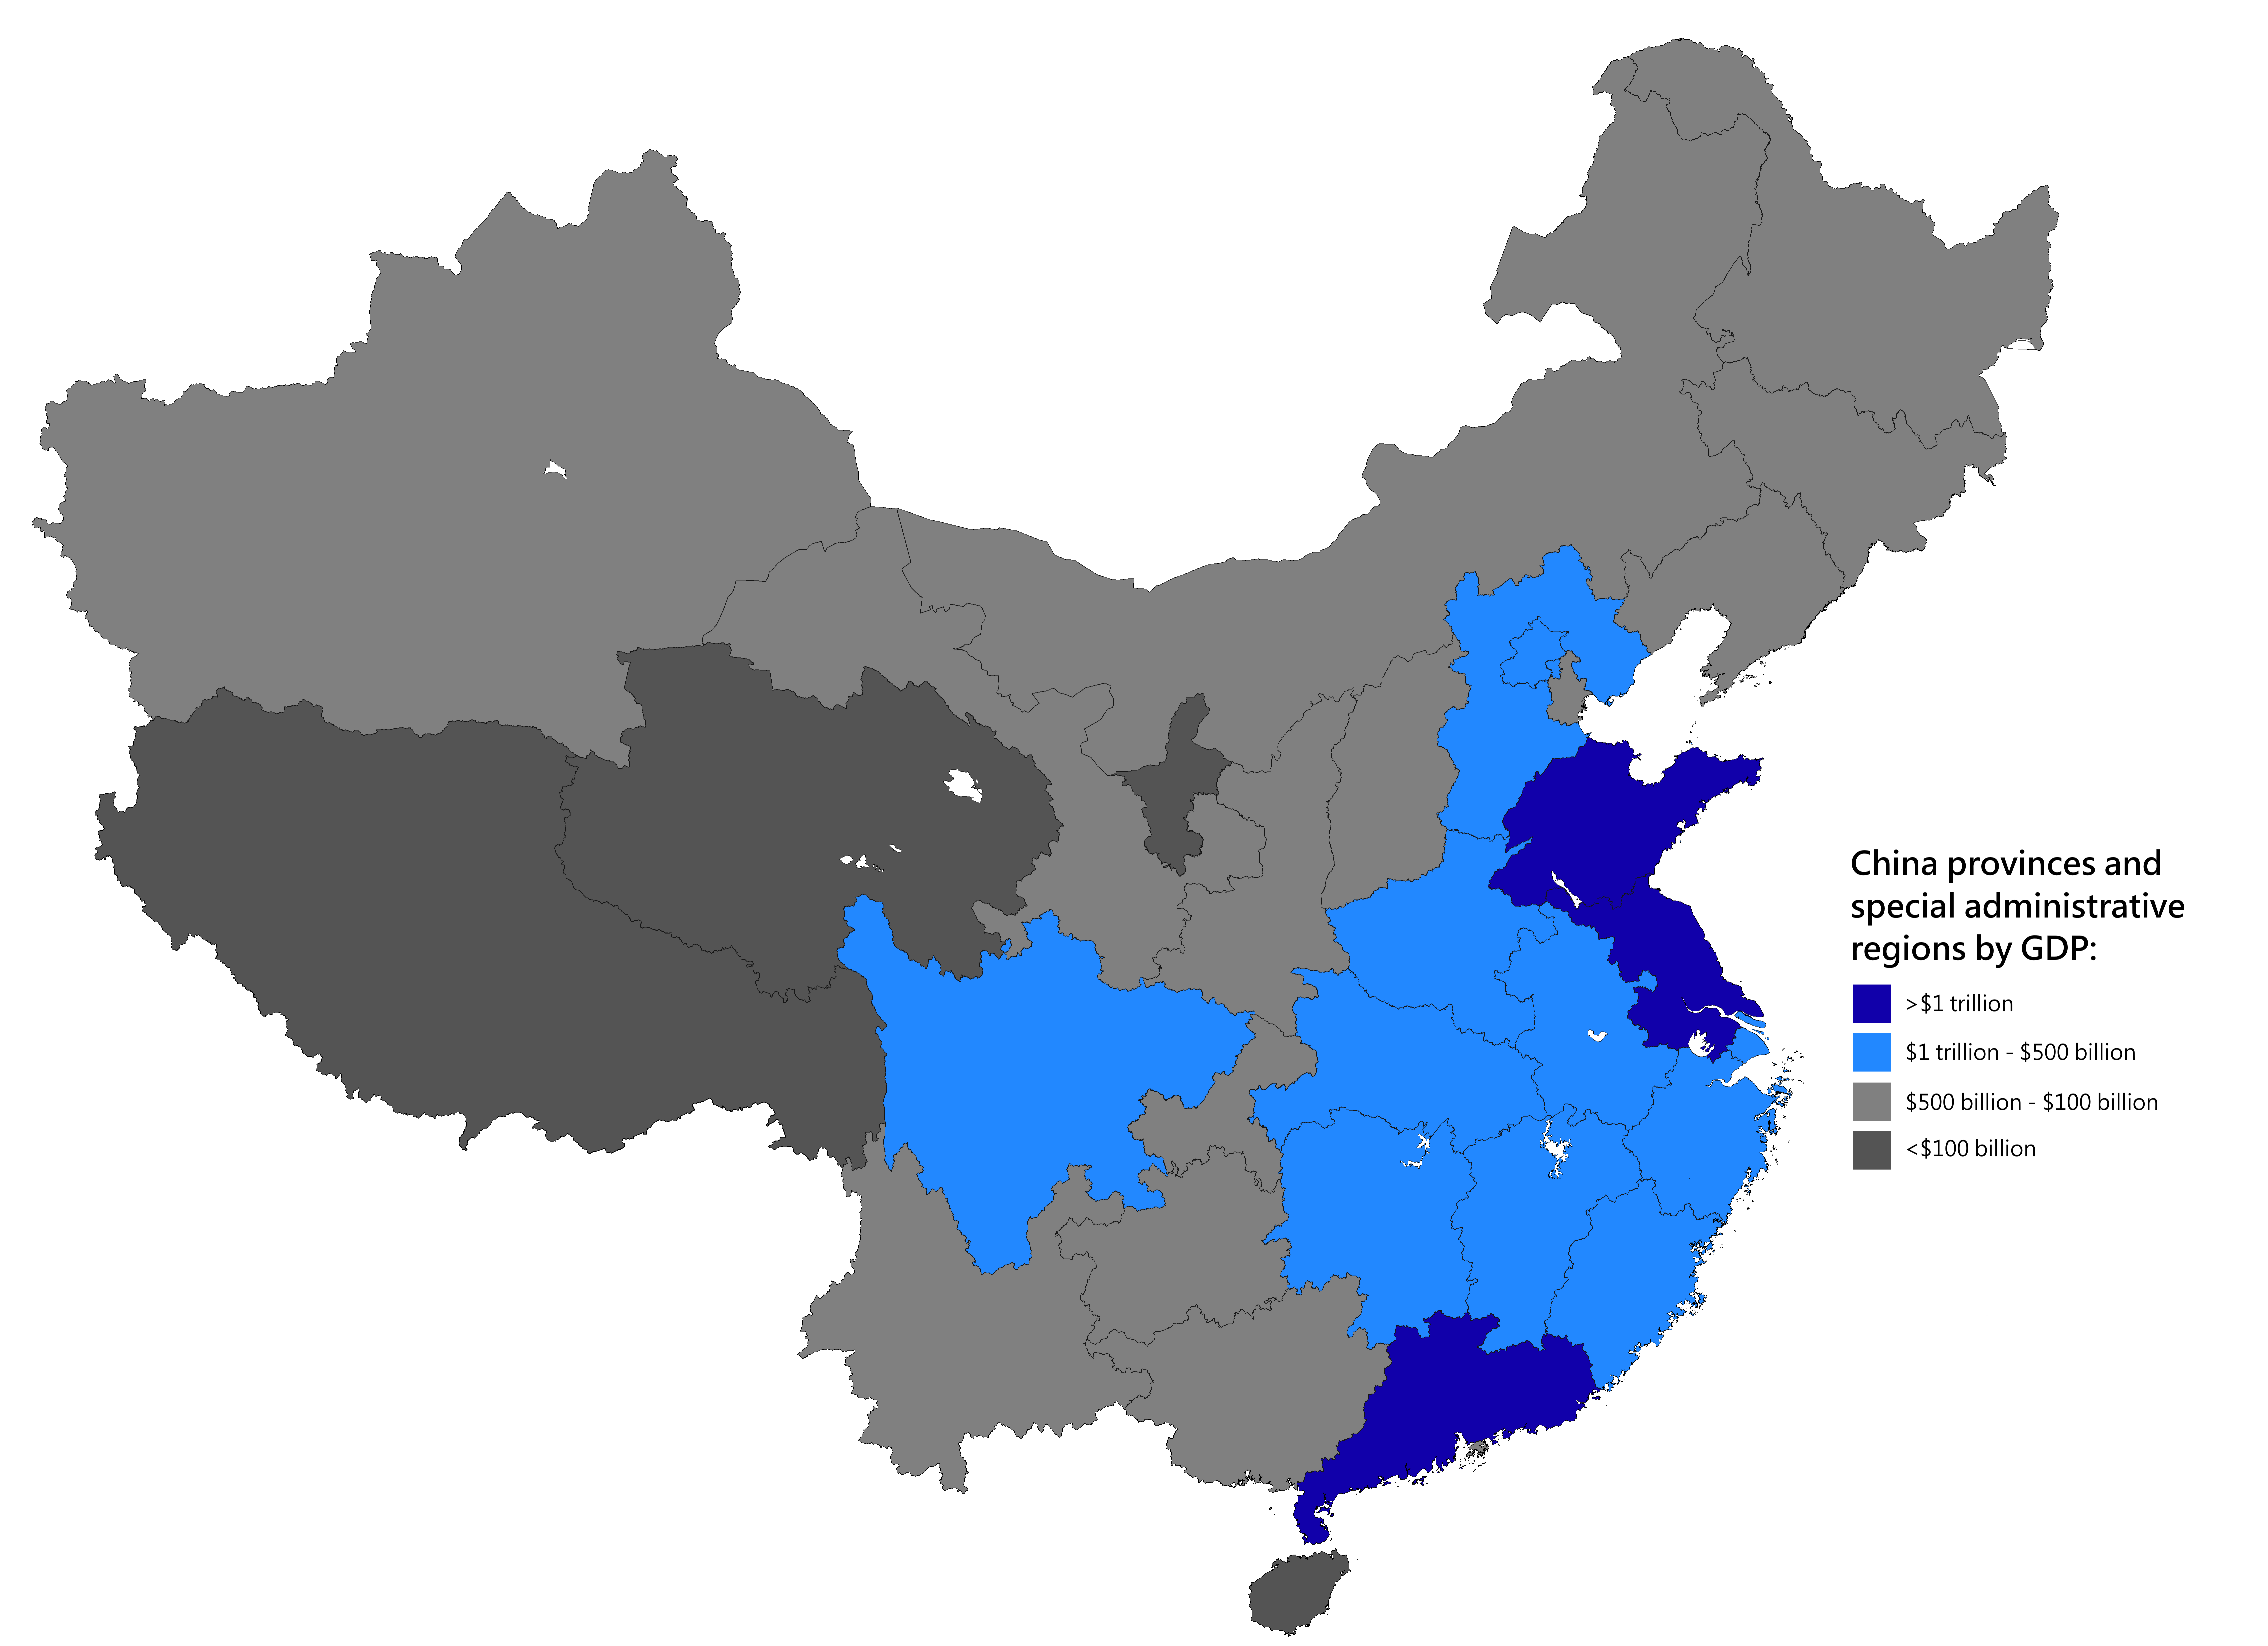
English: Map of Chinese provinces by Gross domestic product in United States dollars (2020)
日本語: 米ドルでの国内総生産による中国の州の地図(2020年)
Русский: Карта провинций Китая по валовому внутреннему продукту в долларах США (2020)
Монгол: АНУ-ын долларын дотоодын нийт бүтээгдэхүүнээр Хятадын мужуудын газрын зураг (2020)
中文(简体):按美元国内生产总值划分的中国省份地图 (2020) (包含未實際控制之疆域)
中文(繁體):按美元國內生產總值劃分的中國省份地圖 (2020) (包含未實際控制之疆域) |
||
| Date |
|
||
| Source |
Legend color for GDP: >$1 trillion
$1 trillion - $500 billion
$500 billion - $100 billion
<$100 billion
Source appearance:
|
||
| Author |
|
||
| Permission (Reusing this file) |
Map of China, administrative divisions: I, the copyright holder of this work, hereby publish it under the following license:
|
.png)
Licensing edit
I, the copyright holder of this work, hereby publish it under the following license:
This file is licensed under the Creative Commons Attribution-Share Alike 4.0 International license.
- You are free:
- to share – to copy, distribute and transmit the work
- to remix – to adapt the work
- Under the following conditions:
- attribution – You must give appropriate credit, provide a link to the license, and indicate if changes were made. You may do so in any reasonable manner, but not in any way that suggests the licensor endorses you or your use.
- share alike – If you remix, transform, or build upon the material, you must distribute your contributions under the same or compatible license as the original.

|
This locator map image could be re-created using vector graphics as an SVG file. This has several advantages; see Commons:Media for cleanup for more information. If an SVG form of this image is available, please upload it and afterwards replace this template with
{{vector version available|new image name}}.
It is recommended to name the SVG file “ProvincialGDPofPRC.svg”—then the template Vector version available (or Vva) does not need the new image name parameter. |
|
|
This map image could be re-created using vector graphics as an SVG file. This has several advantages; see Commons:Media for cleanup for more information. If an SVG form of this image is available, please upload it and afterwards replace this template with
{{vector version available|new image name}}.
It is recommended to name the SVG file “ProvincialGDPofPRC.svg”—then the template Vector version available (or Vva) does not need the new image name parameter. |
File history
Click on a date/time to view the file as it appeared at that time.
| Date/Time | Thumbnail | Dimensions | User | Comment | |
|---|---|---|---|---|---|
| current | 03:50, 28 December 2021 | | 6,804 × 4,937 (481 KB) | Maanshen (talk | contribs) | Update new map and 2020 data |
| 02:47, 18 December 2018 |  | 4,773 × 3,516 (632 KB) | Radom1967 (talk | contribs) | cropped | |
| 13:18, 25 September 2018 |  | 5,000 × 3,520 (1.15 MB) | Radom1967 (talk | contribs) | Updated to 2017 data | |
| 16:59, 8 March 2015 |  | 901 × 1,086 (53 KB) | Cncs wikipedia (talk | contribs) | renew | |
| 02:36, 3 September 2013 |  | 901 × 1,086 (35 KB) | Cncs wikipedia (talk | contribs) | renew | |
| 07:33, 26 July 2013 |  | 901 × 1,090 (36 KB) | Cncs wikipedia (talk | contribs) | repainting | |
| 03:33, 31 May 2011 |  | 901 × 1,090 (34 KB) | Cncs wikipedia (talk | contribs) | == {{int:filedesc}} == {{Information |Description=中国各省份GDP总量分布 GDP of Chinese province-level divisions in 2008 |Source=自制 |Date=2011-05-31 |Author=zh:User:cncs wikipedia |Permission=PD |other_versions=no }} == {{int:license}} = | |
| 17:38, 30 May 2011 |  | 901 × 1,090 (61 KB) | Cncs wikipedia (talk | contribs) | == {{int:filedesc}} == {{Information |Description=中国各省份GDP总量分布 GDP of Chinese province-level divisions in 2008 |Source=自制 |Date=2011-05-30 |Author=zh:User:cncs wikipedia |Permission=PD |other_versions=no }} == {{int:license}} = | |
| 03:31, 30 May 2011 |  | 900 × 794 (74 KB) | Tranletuhan (talk | contribs) | Reverted to version as of 17:04, 20 June 2009 | |
| 10:18, 27 May 2011 |  | 901 × 1,090 (32 KB) | Cncs wikipedia (talk | contribs) | == {{int:filedesc}} == {{Information |Description=中国各省份GDP总量分布 GDP of Chinese province-level divisions in 2010 |Source=自制 |Date=2011-05-27 |Author=zh:User:cncs wikipedia |Permission=PD |other_versions=no }} == {{int:license}} = |
You cannot overwrite this file.
File usage on Commons
The following page uses this file:
File usage on other wikis
The following other wikis use this file:
- Usage on da.wikipedia.org
- Usage on fi.wikipedia.org
- Usage on fr.wikipedia.org
- Usage on ja.wikipedia.org
- Usage on zh-yue.wikipedia.org
- Usage on zh.wikipedia.org