File:Refractive Error Distribution.svg

Original file(SVG file, nominally 512 × 512 pixels, file size: 92 KB)

Captions

Captions

Add a one-line explanation of what this file represents

Summary edit

Description
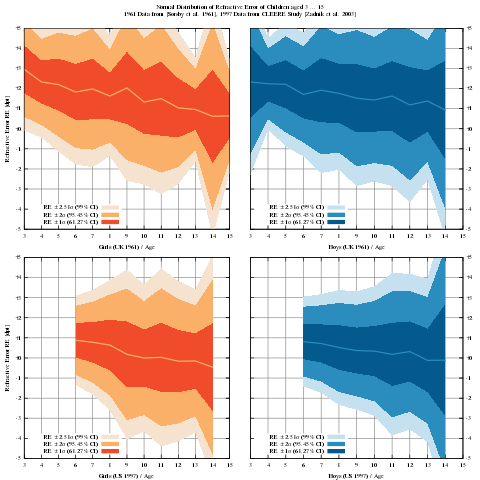
English: Distribution of refractive error in school children.
Source Own work
Author Spitzhörnchen
SVG development
InfoField
 
The SVG code is valid.
 
This chart was created with Gnuplot.
 
 This plot uses embedded text that can be easily translated using a text editor.
Source code
InfoField

Gnuplot code

Generated with gnuplot using these files:
file "Sorsby 1961-girls.dat":

 # Refractive error for girls of age 3...15
 # as a function of age and gender (mean ± SD)
 # 
 # SORSBY A, BENJAMIN B, SHERIDAN M, STONE J, LEARY GA:
 # Refraction and its components during the growth of the eye from the age of three.
 # Memo Med Res Counc. 1961;301(Special):1-67. PMID 13915328.
 #  Table 5.
 #
 # NOTE: values are mean RE, standard error SE of mean RE, and n: SD = SE * sqrt(n)
 #
 # age   RE (D)  SE (D)  n
 3       +2.96   0.19    39
 4       +2.33   0.15    51
 5       +2.20   0.17    58
 6       +1.83   0.19    54
 7       +1.98   0.20    57
 8       +1.63   0.15    60
 9       +2.03   0.24    56
 10      +1.33   0.20    63
 11      +1.50   0.20    85
 12      +1.04   0.19    60
 13      +0.96   0.13    61
 14      +0.62   0.26    80
 15      +0.64   0.181   37


file "Sorsby 1961-boys.dat":

 # Refractive error for boys of age 3...14
 # as a function of age and gender (mean ± SD)
 # 
 # SORSBY A, BENJAMIN B, SHERIDAN M, STONE J, LEARY GA:
 # Refraction and its components during the growth of the eye from the age of three.
 # Memo Med Res Counc. 1961;301(Special):1-67. PMID 13915328.
 #  Table 5.
 #
 # NOTE: values are mean RE, standard error SE of mean RE, and n: SD = SE * sqrt(n)
 #
 # age   RE (D)  SE (D)  n
 3       +2.33   0.24    56
 4       +2.24   0.12    54
 5       +2.21   0.16    56
 6       +1.71   0.16    56
 7       +1.92   0.20    64
 8       +1.76   0.19    60
 9       +1.52   0.24    50
 10      +1.43   0.22    51
 11      +1.63   0.23    57
 12      +1.19   0.23    67
 13      +1.38   0.20    58
 14      +0.93   0.38    42


file "CLEERE-girls.dat":
 # Refractive error for girls of age 6...14
 # (1997 to 1998 academic year) in the Collaborative Longitudinal Evaluation of Ethnicity and Refractive Error (CLEERE) Study,
 # as a function of age and gender (mean ± SD))
 #
 #  Zadnik et al: Ocular component data in schoolchildren as a function of age and gender.
 #  Optom Vis Sci. 2003 Mar;80(3):226-36. PMID 12637834.
 #   Table 3.
 #
 # age   RE (D)  SD (D)
 6       +0.88   0.86
 7       +0.78   1.01
 8       +0.64   1.26
 9       +0.18   1.64
 10      -0.004  1.42
 11      +0.03   1.72
 12      -0.16   1.55
 13      -0.15   1.38
 14      -0.46   2.18

file "CLEERE-boys.dat":
 # Refractive error for boys of age 6...14
 # (1997 to 1998 academic year) in the Collaborative Longitudinal Evaluation of Ethnicity and Refractive Error (CLEERE) Study,
 # as a function of age and gender (mean ± SD)
 # 
 #  Zadnik et al: Ocular component data in schoolchildren as a function of age and gender.
 #  Optom Vis Sci. 2003 Mar;80(3):226-36. PMID 12637834.
 #   Table 3.
 #
 # age   RE (D)  SD (D)
 6       +0.81   0.87
 7       +0.72   0.95
 8       +0.52   1.11
 9       +0.37   1.14
 10      +0.34   1.25
 11      +0.18   1.57
 12      +0.32   1.50
 13      -0.12   1.58
 14      -0.11   2.78

Data

Generated with gnuplot using these codes:
file "Refractive_Error_Distribution.gnuplot.txt": 
 reset
 
 set terminal svg size 800 800 fixed  fname 'Times'  fsize 8 rounded dynamic
 set output "Refractive_Error_Distribution.svg"
 
 set style function lines
 
 set multiplot layout 2, 2 title "Normal Distribution of Refractive Error of Children aged 3 ... 15\n 1961 Data from [Sorsby et al. 1961], 1997 Data from CLEERE Study [Zadnik et al. 2003]"
 
 set grid
 set xtics 1
 set ytics 1
 set y2tics 1
 set xrange [3:15]
 set yrange [-5:+5]
 set y2range [-5:+5]
 
 set key left bottom
 
 set format y "%+g"
 set format y2 ""
 set xlabel "Girls (UK 1961) / Age"
 set ylabel "Refractive Error RE [dpt]"
 
 #
 # The Sorsby dataset provides standard error, not standard deviation. For conversion we need to multiply by sqrt(n)
 #
 plot "Sorsby 1961-girls.dat" \
            u 1:($2-2.58*$3*sqrt($4)):($2+2.58*$3*sqrt($4)) with filledcurve title "RE ± 2.58σ (99% CI)" lc rgb "#F5E3D0", \
         "" u 1:($2-2*$3*sqrt($4)):($2+2*$3*sqrt($4)) with filledcurve title "RE ± 2σ (95.45% CI)" lc rgb "#FAB068", \
         "" u 1:($2-$3*sqrt($4)):($2+$3*sqrt($4)) with filledcurve title "RE ± 1σ (68.27% CI)" lc rgb "#F04C2B", \
         "" u 1:2 with lines notitle lc rgb "#FAB068" lw 2
 
 set xlabel "Boys (UK 1961) / Age"
 unset ylabel
 set format y ""
 set format y2 "%+g"
 
 plot "Sorsby 1961-boys.dat" \
            u 1:($2-2.58*$3*sqrt($4)):($2+2.58*$3*sqrt($4)) with filledcurve title "RE ± 2.58σ (99% CI)" lc rgb "#C5E1EF", \
         "" u 1:($2-2*$3*sqrt($4)):($2+2*$3*sqrt($4)) with filledcurve title "RE ± 2σ (95.45% CI)" lc rgb "#2B8CBE", \
         "" u 1:($2-$3*sqrt($4)):($2+$3*sqrt($4)) with filledcurve title "RE ± 1σ (68.27% CI)" lc rgb "#045A8D", \
         "" u 1:2 with lines notitle lc rgb "#2B8CBE" lw 2
 
 set format y "%+g"
 set format y2 ""
 set xlabel "Girls (US 1997) / Age"
 set ylabel "Refractive Error RE [dpt]"
 plot "CLEERE-girls.dat" \
            u 1:($2-2.58*$3):($2+2.58*$3) with filledcurve title "RE ± 2.58σ (99% CI)" lc rgb "#F5E3D0", \
         "" u 1:($2-2*$3):($2+2*$3) with filledcurve title "RE ± 2σ (95.45% CI)" lc rgb "#FAB068", \
         "" u 1:($2-$3):($2+$3) with filledcurve title "RE ± 1σ (68.27% CI)" lc rgb "#F04C2B", \
         "" u 1:2 with lines notitle lc rgb "#FAB068" lw 2
 
 set xlabel "Boys (US 1997) / Age"
 unset ylabel
 set format y ""
 set format y2 "%+g"
 
 plot "CLEERE-boys.dat" \
            u 1:($2-2.58*$3):($2+2.58*$3) with filledcurve title "RE ± 2.58σ (99% CI)" lc rgb "#C5E1EF", \
         "" u 1:($2-2*$3):($2+2*$3) with filledcurve title "RE ± 2σ (95.45% CI)" lc rgb "#2B8CBE", \
         "" u 1:($2-$3):($2+$3) with filledcurve title "RE ± 1σ (68.27% CI)" lc rgb "#045A8D", \
         "" u 1:2 with lines notitle lc rgb "#2B8CBE" lw 2

command to generate SVG: "gnuplot Refractive_Error_Distribution.gnuplot.txt"

Licensing edit

Public domain I, the copyright holder of this work, release this work into the public domain. This applies worldwide.
In some countries this may not be legally possible; if so:
I grant anyone the right to use this work for any purpose, without any conditions, unless such conditions are required by law.

File history

Click on a date/time to view the file as it appeared at that time.

Date/TimeThumbnailDimensionsUserComment
current10:21, 17 September 2008Thumbnail for version as of 10:21, 17 September 2008512 × 512 (92 KB)Spitzhörnchen (talk | contribs){{Information |Description={{en|1=Distribution of refractive error in school children. Generated with gnuplot using these files: file "Sorsby 1961-girls.dat": # Refractive error for girls of age 3...15 # as a function of age and gender (mean ± SD) #

There are no pages that use this file.

File usage on other wikis

The following other wikis use this file:

Metadata