File:RichterFreqEnergyGraph-en.svg

Size of this PNG preview of this SVG file: 637 × 401 pixels. Other resolutions: 320 × 201 pixels | 640 × 403 pixels | 1,024 × 645 pixels | 1,280 × 806 pixels | 2,560 × 1,612 pixels.
Original file (SVG file, nominally 637 × 401 pixels, file size: 83 KB)
Captions
Captions
Add a one-line explanation of what this file represents
Summary edit
| Description |
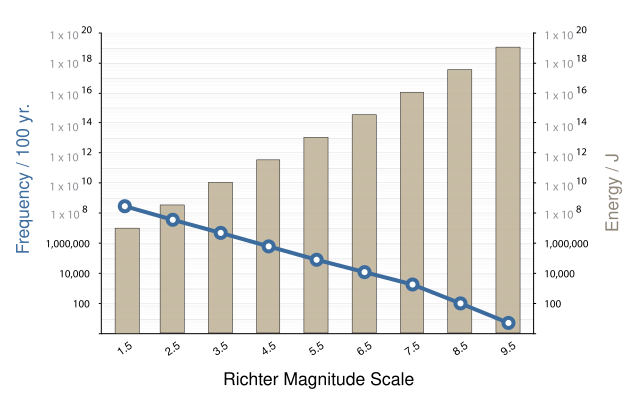
English: A doubly logarithmic graph showing the frequency and energy of earthquakes under the Richter scale. Note that the axis are identical, and that the energy contained rises 10-fold more rapidly than the decrease in frequency of occurance.
|
| Date | |
| Source | Own work |
| Author | Jkwchui |

|
This SVG file contains embedded text that can be translated into your language, using any capable SVG editor, text editor or the SVG Translate tool. For more information see: About translating SVG files. |
Licensing edit
I, the copyright holder of this work, hereby publish it under the following licenses:
This file is licensed under the Creative Commons Attribution-Share Alike 3.0 Unported license.
- You are free:
- to share – to copy, distribute and transmit the work
- to remix – to adapt the work
- Under the following conditions:
- attribution – You must give appropriate credit, provide a link to the license, and indicate if changes were made. You may do so in any reasonable manner, but not in any way that suggests the licensor endorses you or your use.
- share alike – If you remix, transform, or build upon the material, you must distribute your contributions under the same or compatible license as the original.

|
Permission is granted to copy, distribute and/or modify this document under the terms of the GNU Free Documentation License, Version 1.2 or any later version published by the Free Software Foundation; with no Invariant Sections, no Front-Cover Texts, and no Back-Cover Texts. A copy of the license is included in the section entitled GNU Free Documentation License. |
You may select the license of your choice.
File history
Click on a date/time to view the file as it appeared at that time.
| Date/Time | Thumbnail | Dimensions | User | Comment | |
|---|---|---|---|---|---|
| current | 18:34, 16 February 2011 | | 637 × 401 (83 KB) | Jkwchui (talk | contribs) | {{Information |Description ={{en|1='''A doubly logarithmic graph showing the frequency and energy of earthquakes under the Richter scale'''. Note that the axis are identical, and that the energy contained rises 10-fold more rapidly than the decrease i |
You cannot overwrite this file.
File usage on Commons
There are no pages that use this file.
File usage on other wikis
The following other wikis use this file:
- Usage on en.wikipedia.org