File:Servo Diagram.svg

Size of this PNG preview of this SVG file: 468 × 308 pixels. Other resolutions: 320 × 211 pixels | 640 × 421 pixels | 1,024 × 674 pixels | 1,280 × 842 pixels | 2,560 × 1,685 pixels.
Original file (SVG file, nominally 468 × 308 pixels, file size: 45 KB)
Captions
Captions
Add a one-line explanation of what this file represents
Summary edit
| Description |
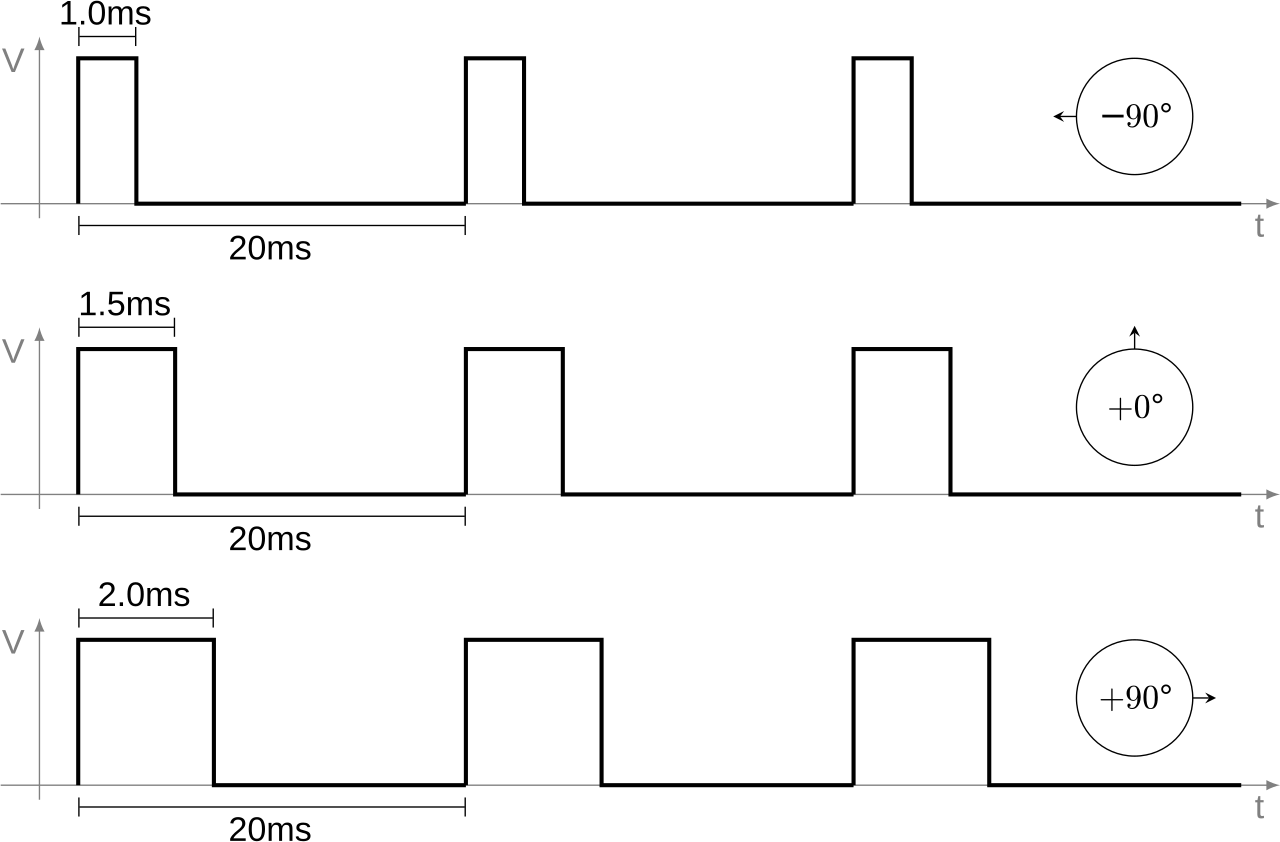
English: Diagram showing how a servo motor typically reacts on different PWM signals. |
| Date | |
| Source | Own work |
| Author | Stefan Tauner |
| SVG development | This W3C-invalid diagram was created with Inkscape, or with something else. This diagram uses embedded text that can be easily translated using a text editor. |
Source Code edit
The respective XML-code:
\begin{tikzpicture}[
measure line/.style={thin,|-|},
measure text/.style={midway},
axis line/.style={color=gray,thin,-latex},
axis text/.style={color=gray,},
heading/.style={-stealth},
/pgf/number format/showpos
]
\usetikzlibrary{calc}
\coordinate (base) at (0,0);
\def\numperiod{2}
\def\pulseneut{1}
\def\period{\pulseneut*4}
\def\variance{0.4}
\def\lineexcess{\period*0.1}
\def\height{3}
\def\amp{0.5*\height}
\def\circrad{\amp*0.4}
\def\arrowsep{-\height*0.075}
\def\markerlen{\circrad*0.4}
\newcommand{\pulse}[1]{-- ++(0, \amp) -- ++(#1, 0) -- ++(0, -\amp)}
\newcommand{\mathresult}[1]{%
\pgfmathparse{#1}\pgfmathsetmacro\mymathresult{\pgfmathresult}%
}
\foreach \s in {0,1,2} {
\def\pulsew{\pulseneut+\pulseneut*\variance - \s*\variance}
\def\periodrest{\period-\pulseneut-\pulseneut*\variance+\s*\variance}
\coordinate (curbase) at ($ (base) + (0, \s*\height)$);
\coordinate (start) at ($ (curbase) + (-\lineexcess, 0)$);
\coordinate (end) at ($ (start) + (\period*\numperiod + \period + 2*\lineexcess, 0) $);
\draw[axis line] (start) ++(-0.1*\period, 0) -- (end) node[axis text,anchor=north east]{t};
\draw[axis line] (start) ++(0, -0.1*\amp) -- ++(0, 1.25*\amp) node[axis text,anchor=north east]{V};
\draw[measure line] ($(curbase) + (0, \arrowsep)$) -- ($(curbase) + (\period, \arrowsep)$) node[measure text,below] {20 ms};
\foreach \per in {0,1,...,\numperiod} {
\coordinate (pstart) at ($ (curbase) + (\period*\per, 0) $);
\draw[very thick] (pstart) \pulse{\pulsew} -- ++({\periodrest}, 0);
}
\def\pulsewtxt{\pgfmathparse{2-\s*0.5}\pgfmathresult}
\draw[measure line] (curbase) ++(0,\amp) ++(0, -\arrowsep) -- +(\pulsew, 0) node[measure text,above] {\pulsewtxt\space ms};
};
\def\s{0} % stupid cosine/sine functions don't work as expected :/
\def\rottxt{\pgfmathparse{90-\s*90}\pgfmathprintnumber{\pgfmathresult}°}
\coordinate (circoff) at ($ (base) + (0, \s*\height) + (\period*\numperiod + \period/2, 0) + (\circrad*1.5, \amp*0.6) $);
\draw (circoff) circle(\circrad) node{\rottxt};
\draw[heading] (circoff) ++($(+\circrad, 0)$) -- ++($(+\markerlen, 0)$);
\def\s{1}
\def\rottxt{\pgfmathparse{90-\s*90}\pgfmathprintnumber{\pgfmathresult}°}
\coordinate (circoff) at ($ (base) + (0, \s*\height) + (\period*\numperiod + \period/2, 0) + (\circrad*1.5, \amp*0.6) $);
\draw (circoff) circle(\circrad) node{\rottxt};
\draw[heading] (circoff) ++($(0, +\circrad)$) -- ++($(0, +\markerlen)$);
\def\s{2}
\def\rottxt{\pgfmathparse{90-\s*90}\pgfmathprintnumber{\pgfmathresult}°}
\coordinate (circoff) at ($ (base) + (0, \s*\height) + (\period*\numperiod + \period/2, 0) + (\circrad*1.5, \amp*0.6) $);
\draw (circoff) circle(\circrad) node{\rottxt};
\draw[heading] (circoff) ++($(-\circrad, 0)$) -- ++($(-\markerlen, 0)$);
\end{tikzpicture}
Licensing edit
I, the copyright holder of this work, hereby publish it under the following license:
This file is licensed under the Creative Commons Attribution-Share Alike 3.0 Unported license.
- You are free:
- to share – to copy, distribute and transmit the work
- to remix – to adapt the work
- Under the following conditions:
- attribution – You must give appropriate credit, provide a link to the license, and indicate if changes were made. You may do so in any reasonable manner, but not in any way that suggests the licensor endorses you or your use.
- share alike – If you remix, transform, or build upon the material, you must distribute your contributions under the same or compatible license as the original.
File history
Click on a date/time to view the file as it appeared at that time.
| Date/Time | Thumbnail | Dimensions | User | Comment | |
|---|---|---|---|---|---|
| current | 18:04, 24 December 2013 | | 468 × 308 (45 KB) | Stefantauner (talk | contribs) | Fix for bad upload. Added axis description and included the source code to regenerate the picture in the svg. |
| 18:03, 24 December 2013 |  | 468 × 308 (45 KB) | Stefantauner (talk | contribs) | Fix for bad upload. Added axis description and included the source code to regenerate the picture in the svg. | |
| 17:57, 24 December 2013 |  | 512 × 512 (37 KB) | Stefantauner (talk | contribs) | Added axis description and included the source code to regenerate the picture in the svg. | |
| 04:01, 24 December 2013 |  | 454 × 315 (44 KB) | Stefantauner (talk | contribs) | User created page with UploadWizard |
You cannot overwrite this file.
File usage on Commons
The following page uses this file: