File:Sine cosine integral.svg

Size of this PNG preview of this SVG file: 512 × 384 pixels. Other resolutions: 320 × 240 pixels | 640 × 480 pixels | 1,024 × 768 pixels | 1,280 × 960 pixels | 2,560 × 1,920 pixels.
Original file (SVG file, nominally 512 × 384 pixels, file size: 37 KB)
Captions
Captions
Add a one-line explanation of what this file represents
Summary edit
| Description |
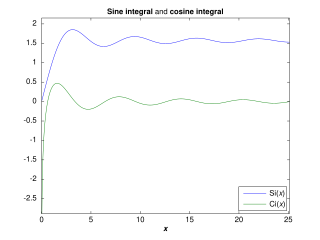
English: This is a plot of sine integral and cosine integral functions (for ).
The plot was produced by the following MATLAB code: x = 0:0.01*pi:8*pi;
Si = sinint(x); Ci = cosint(x); % requires Symbolix Math Toolbox
plot(x,Si, x,Ci);
margin = 0.3;
axis([min(x) max(x) min([min(Si),min(Ci)]) max([max(Si),max(Ci)]) + margin])
title('{\bfSine integral} and {\bfcosine integral}');
legend('Si({\itx})', 'Ci({\itx})', 'Location','SouthEast')
xlabel('{\it{\bfx}}')
|
| Date | |
| Source | Own work |
| Author | DmitTrix |

Licensing edit
| I, the copyright holder of this work, release this work into the public domain. This applies worldwide. In some countries this may not be legally possible; if so: I grant anyone the right to use this work for any purpose, without any conditions, unless such conditions are required by law. |
File history
Click on a date/time to view the file as it appeared at that time.
| Date/Time | Thumbnail | Dimensions | User | Comment | |
|---|---|---|---|---|---|
| current | 13:30, 31 March 2009 | | 512 × 384 (37 KB) | DmitTrix (talk | contribs) | {{Information |Description={{en|1=This is a plot of w:sine integral and w:cosine integral functions (for <math>0 < x\le 8\pi </math>). The plot was produced by the following w:MATLAB code: <source lang="matlab"> margin = 0.3; x = 0:0.01*pi |
You cannot overwrite this file.
File usage on Commons
There are no pages that use this file.
File usage on other wikis
The following other wikis use this file:
- Usage on ca.wikipedia.org
- Usage on de.wikipedia.org
- Usage on en.wikipedia.org
- Usage on es.wikipedia.org
- Usage on fr.wikipedia.org
- Usage on id.wikipedia.org
- Usage on ko.wikipedia.org
- Usage on pl.wikipedia.org
- Usage on uk.wikipedia.org