File:Speed-flow horseshoe diagram traffic congestion.svg

Size of this PNG preview of this SVG file: 800 × 400 pixels. Other resolutions: 320 × 160 pixels | 640 × 320 pixels | 1,024 × 512 pixels | 1,280 × 640 pixels | 2,560 × 1,280 pixels.
Original file (SVG file, nominally 800 × 400 pixels, file size: 8 KB)
Captions
Captions
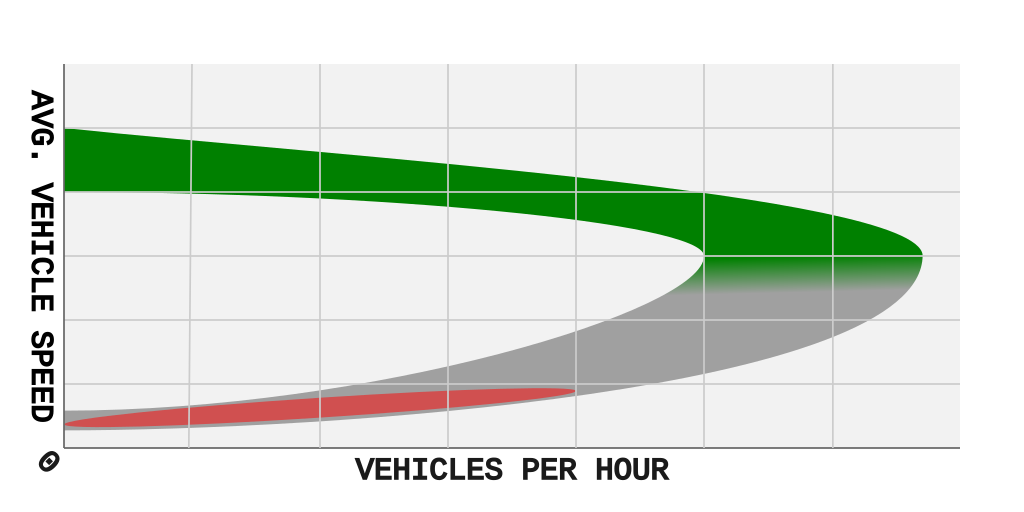
A speed-flow diagram showing that traffic congestion is formed when vehicle volume or demand exceeds capacity
Summary edit
| Description |
English: Speed-flow diagram or speed-volume diagram: vehicle speed versus vehicles per hour passing through a point on a highway. The horseshoe shape indicates that vehicle throughput collapses when volume is 80%-100% of capacity. The traffic mode changes from free-flowing in the green area, to congested in the gray area. The red area marks rush-hour traffic.
Joe Cortright (April 22, 2020) What Covid-19 teaches us about how to fix freeways[1] SH1 Northbound at Green Lane – What happens here?[2], Waka Kotahi NZ Transport Agency, 2016 |
| Date | |
| Source | Own work |
| Author | HueSurname |
Licensing edit
I, the copyright holder of this work, hereby publish it under the following license:
This file is licensed under the Creative Commons Attribution-Share Alike 4.0 International license.
- You are free:
- to share – to copy, distribute and transmit the work
- to remix – to adapt the work
- Under the following conditions:
- attribution – You must give appropriate credit, provide a link to the license, and indicate if changes were made. You may do so in any reasonable manner, but not in any way that suggests the licensor endorses you or your use.
- share alike – If you remix, transform, or build upon the material, you must distribute your contributions under the same or compatible license as the original.
File history
Click on a date/time to view the file as it appeared at that time.
| Date/Time | Thumbnail | Dimensions | User | Comment | |
|---|---|---|---|---|---|
| current | 15:47, 23 August 2023 | | 800 × 400 (8 KB) | HueSurname (talk | contribs) | Uploaded own work with UploadWizard |
You cannot overwrite this file.
File usage on Commons
The following page uses this file:
File usage on other wikis
The following other wikis use this file:
- Usage on en.wikipedia.org