File:Super95price monthly germany 91-14.svg

Size of this PNG preview of this SVG file: 420 × 320 pixels. Other resolutions: 315 × 240 pixels | 630 × 480 pixels | 1,008 × 768 pixels | 1,280 × 975 pixels | 2,560 × 1,950 pixels.
Original file (SVG file, nominally 420 × 320 pixels, file size: 47 KB)
Captions
Captions
Add a one-line explanation of what this file represents
Summary edit
| Description |
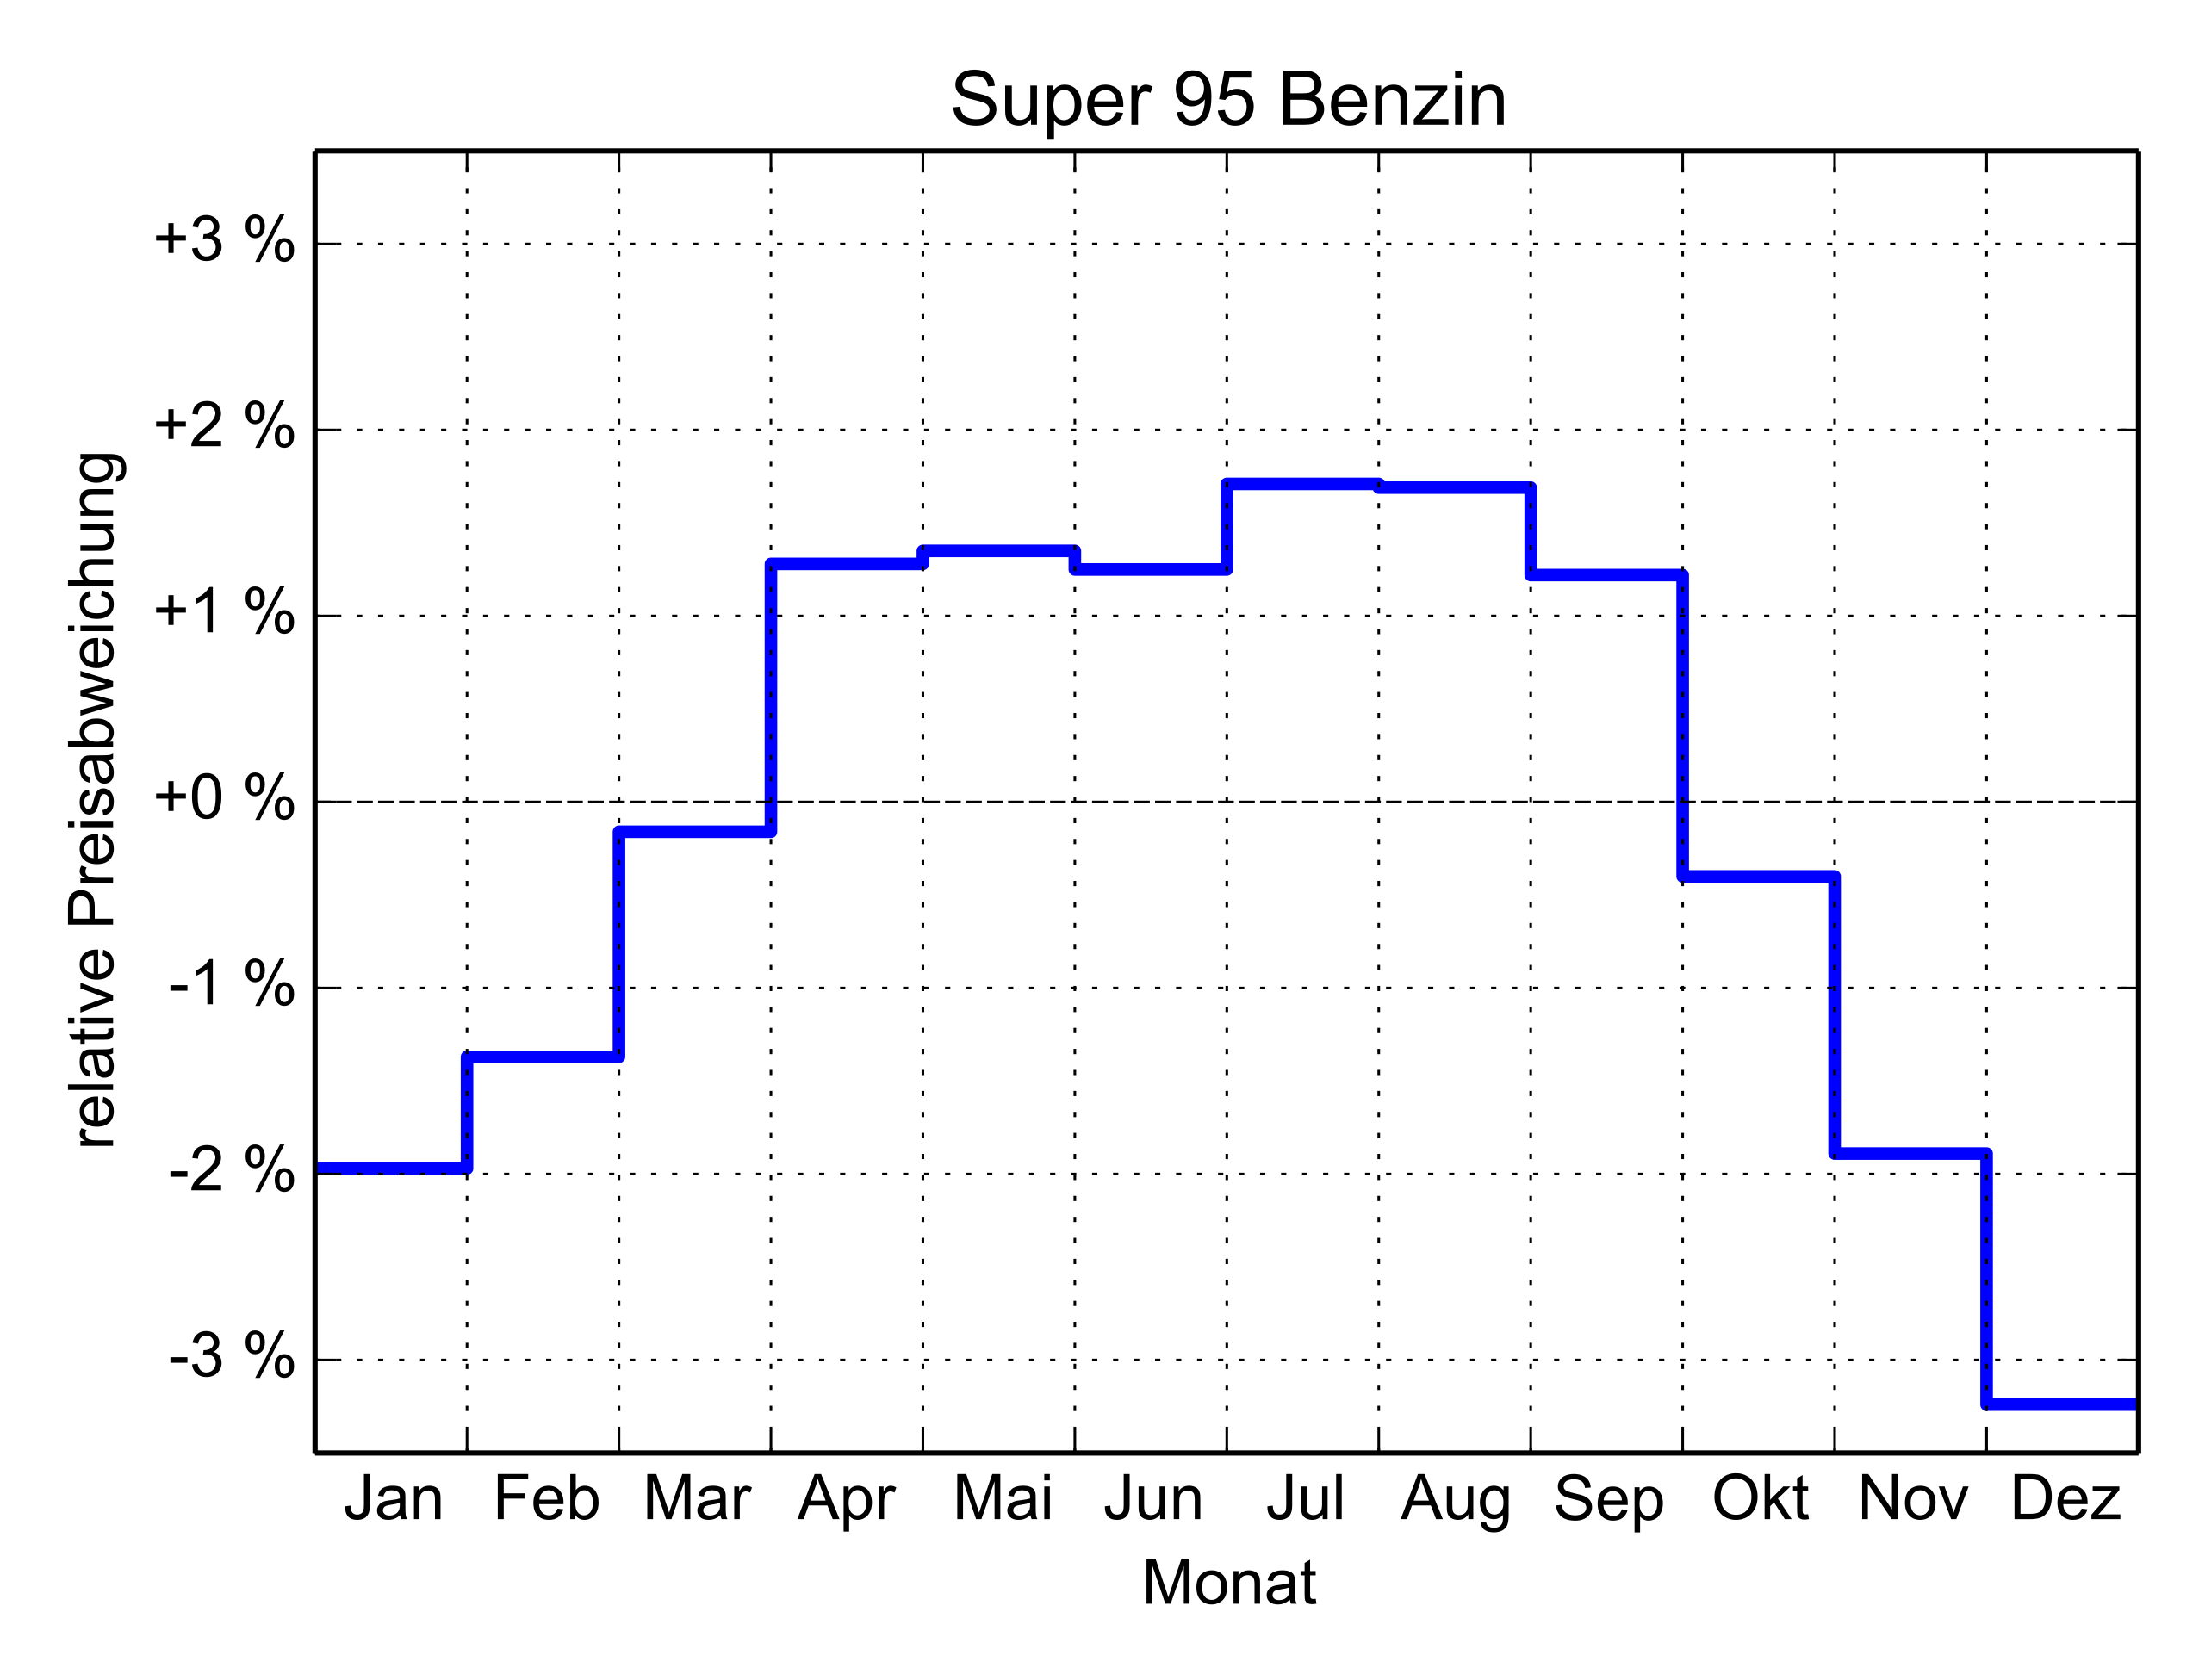
English: Plot of deviations in percent from the average monthly price for super 95 gasoline in Germany from 1990 to 2014. Data source: Aral Kraftstoff Archiv |
| Date | |
| Source |
Own work This plot was created with Matplotlib. |
| Author | Geek3 |
| Other versions |
Source Code edit
The plot was generated with Matplotlib
| Python Matplotlib source code |
|---|
#!/usr/bin/python
# -*- coding: utf8 -*-

import numpy as np
import matplotlib as mpl
import matplotlib.pyplot as plt
import string

fname = 'super95price_monthly_germany_90-14'

# monthly deviations in percent from the average yearly price for super 95
# gasoline in Germany 1990 - 2014
# source: Aral
super95_pricerel_perc_monthly = [
0.9803, 0.9863, 0.9984, 1.0128, 1.0135, 1.0125,
1.0171, 1.0169, 1.0122, 0.996, 0.9811, 0.9676]

percents = 100 * (np.array(super95_pricerel_perc_monthly) - 1.0)

plt.close('all')
fig = plt.figure(figsize=(421/72., 321/72.))
ax = fig.gca()
plt.xlim(0, 12)
plt.ylim(-3.5, 3.5)
plt.title('Super 95 Benzin')
plt.xlabel('Monat')
plt.ylabel('relative Preisabweichung')
plt.grid(True)
ax.set_xticks(np.arange(12))
ax.set_xticks(np.arange(12) + 0.5, minor=True)
for tick in ax.xaxis.get_minor_ticks():
    tick.tick1line.set_markersize(0)
    tick.tick2line.set_markersize(0)
ax.set_xticklabels([])
ax.set_xticklabels(['Jan', 'Feb', 'Mar', 'Apr', 'Mai', 'Jun', 'Jul',
    'Aug', 'Sep', 'Okt', 'Nov', 'Dez'], minor=True)
ax.yaxis.set_major_formatter(mpl.ticker.FormatStrFormatter('%+d %%'))

fig.canvas.draw()
for l in ax.yaxis.get_gridlines():
    if l.get_ydata()[0] == 0.0:
        l.set_dashes([3,1])

ax.plot([(i+1)/2 for i in range(24)], [percents[i/2] for i in range(24)], lw=2.4)

plt.tight_layout()
plt.savefig(fname + '.svg')
f = open(fname + '.svg', 'r')
txt = string.replace(f.read(), 'pt', 'px', 2)
f.close()
f = open(fname + '.svg', 'w')
f.write(txt)
f.close()
|
Licensing edit
I, the copyright holder of this work, hereby publish it under the following licenses:

|
Permission is granted to copy, distribute and/or modify this document under the terms of the GNU Free Documentation License, Version 1.2 or any later version published by the Free Software Foundation; with no Invariant Sections, no Front-Cover Texts, and no Back-Cover Texts. A copy of the license is included in the section entitled GNU Free Documentation License. |
This file is licensed under the Creative Commons Attribution-Share Alike 3.0 Unported, 2.5 Generic, 2.0 Generic and 1.0 Generic license.
- You are free:
- to share – to copy, distribute and transmit the work
- to remix – to adapt the work
- Under the following conditions:
- attribution – You must give appropriate credit, provide a link to the license, and indicate if changes were made. You may do so in any reasonable manner, but not in any way that suggests the licensor endorses you or your use.
- share alike – If you remix, transform, or build upon the material, you must distribute your contributions under the same or compatible license as the original.
You may select the license of your choice.
File history
Click on a date/time to view the file as it appeared at that time.
| Date/Time | Thumbnail | Dimensions | User | Comment | |
|---|---|---|---|---|---|
| current | 20:26, 13 September 2015 | | 420 × 320 (47 KB) | Geek3 (talk | contribs) | {{Information |Description ={{en|1=Plot of deviations in percent from the average monthly price for super 95 gasoline in Germany from 1990 to 2014. Data source: Aral Kraftstoff Archiv}} |Source ={{own}}</br>{{Created with Matplotlib|v}} |Aut... |
You cannot overwrite this file.
File usage on Commons
The following page uses this file: