File:Temperature & mortality of London, 1840-50 Wellcome L0039176.jpg

Original file (4,660 × 3,787 pixels, file size: 12.88 MB, MIME type: image/jpeg)
Captions
Captions
Summary edit
| Temperature & mortality of London, 1840-50 | |||
|---|---|---|---|
| Title |
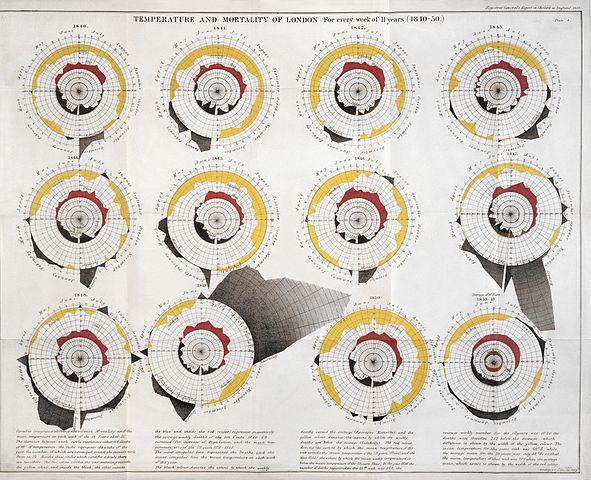
Temperature & mortality of London, 1840-50 |
||
| Description |
Chart showing temperature and mortality of London for every week of 11 years, 1840-50. The shaded black colour denotes the extent by which the weekly deaths exceed the average; the yellow colour denotes the extent by which the weekly deaths are below the average; the red colour denotes the extent by which the mean temperature of the week exceeds the mean temperature of the years 1771-1849; the solid black denotes the extent by which the mean weekly temperature is below the mean temperature of the years 1771-1849. 1852 |
||
| Credit line |
|
||
| Notes |
General Collections Keywords: Epidemic, Infectious disease, Mortality Rate, Cholera, Epidemiology, Temperature, Communicable Diseases, Epidemics, Victorian, England |
||
| References |
|
||
| Source/Photographer |
https://wellcomeimages.org/indexplus/obf_images/c5/46/29befd16bf26e6d12b154b073bac.jpg (hi-res image)
|
||
| Other versions |
    |
||
Licensing edit
- You are free:
- to share – to copy, distribute and transmit the work
- to remix – to adapt the work
- Under the following conditions:
- attribution – You must give appropriate credit, provide a link to the license, and indicate if changes were made. You may do so in any reasonable manner, but not in any way that suggests the licensor endorses you or your use.
File history
Click on a date/time to view the file as it appeared at that time.
| Date/Time | Thumbnail | Dimensions | User | Comment | |
|---|---|---|---|---|---|
| current | 19:36, 12 July 2014 | | 4,660 × 3,787 (12.88 MB) | Faebot (talk | contribs) | Crop bottom 26 pixels to remove watermark (4660x3787) |
| 13:29, 12 July 2014 |  | 4,660 × 3,813 (6.66 MB) | Fæ (talk | contribs) | {{watermark}} =={{int:filedesc}}== {{Artwork |artist = |author = |title =Temperature & mortality of London, 1840-50 |description =Chart showing temperature and mortality of London for every week of 11 years,... |
You cannot overwrite this file.
File usage on Commons
The following 9 pages use this file:
- File:Cholera deaths in England & Wales from May-November, 1849 Wellcome L0039177.jpg
- File:Diagram of cholera deaths in England during 1849 Wellcome L0039178.jpg
- File:Diagram representing the mortality from cholera in London Wellcome L0073550.jpg
- File:London mortality; plague years & cholera years Wellcome L0039175.jpg
- File:Map of England showing prevalence of cholera, 1849 Wellcome L0039174.jpg
- File:Report on the mortality of cholera in England 1848-49. Wellcome L0016434.jpg
- File:Report on the mortality of cholera in England Wellcome L0049742.jpg
- File:Report on the mortality of cholera in England Wellcome L0049743.jpg
- File:Temperature & mortality of London, 1840-50 Wellcome L0039176.jpg