File:TheKuiperBelt 55AU Centaurs.svg

Original file (SVG file, nominally 800 × 400 pixels, file size: 51 KB)
Captions
Captions
Summary edit
| Description |
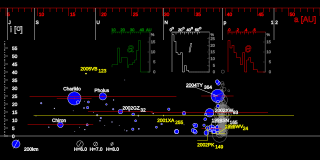
(voir plus loin pour la description en français) Distribution of orbits for Centaurs. Generated by a program written by Eurocommuter. |
| Date | 16 February 2006 (original upload date) |
| Source | No machine-readable source provided. Own work assumed (based on copyright claims). |
| Author | No machine-readable author provided. Eurocommuter~commonswiki assumed (based on copyright claims). |
Main graph edit
The position of an object represents
- its orbit’s semi-major axis a in AU (horizontal axis)
- orbit’s inclination i in degrees (vertical axis).
The size of the circle illustrates the object’s size relative to others. For a few large objects, the diameter drawn represents the best current estimates. For all others, the circles represent the absolute magnitude of the object. The eccentricity of the orbit is shown indirectly by a segment extending from the left (perihelion) to the aphelion to the right. In other words, the segment illustrates the variations of the object's distance from the Sun. Objects with nearly circular orbits will show short segments while highly elliptical orbits will be represented by long segments.
Orbits of planets (Jupiter, Saturn, Uranus, Neptune and Pluto) are marked with white vertical bars. The bar labelled 1:2 shows the resonance with Neptune considered the edge of the main Kuiper Belt.
Histograms edit
Histograms show the population of objects with the parameter (eccentricity e and inclination i respectively) inside the given interval. The population is expressed in % of the total population (vertical axis)
- for inclination, the interval is 5o, i.e. the first bar shows the relative population of objects with i in 0-5o range, the next in 5-10o range etc.
- for the eccentricity e, the interval is 0.1, i.e. the first bar shows the relative population of objects with e in 0-0.1 range (quite circular orbits)
- for semi-major axis a, the interval is 2AU i.e. the first bar shows the relative population of objects with e in 10-12AU range.
Data source edit
MPCORB as of Feb 14th, 2006
Description en français edit
Distribution des centaures.Graphe généré par un programme écrit par Eurocommuter.
Graphe principal edit
La position d’un objet représente
- le demi axe majeur (rayon moyen) de son orbite a en in au (l’axe horizontal)
- l’inclination de son orbite i en degrés (axe vertical).
Le diamètre du cercle montre la taille relative de l’objet aux autres. Pour quelques grands objets, le diamètre représente la meilleure estimation connue. Pour tous les autre, le diamètre du cercle représente la magnitude absolue de l’objet. L’excentricité de l’orbite est représentée indirectement par un segment qui s’étend du périhélie à gauche à l’aphélie à droite. En d’autres termes, le segment illustre les variations de la distance du Soleil. Les objets avec des orbites quasi circulaires ont donc des courts segments et les orbites très excentriques sont repérées par des segments longs.
Les positions des résonances avec Neptune sont marqués par des traits verticaux; 1:1 marque la position de l’orbite de Neptune (et ses Troyens), 2:3 marque l’orbite de Pluton (et ses lunes) etc.
Les orbites des planètes (Jupiter, Saturne, Uranus, Neptune et Pluton) are marquées avec des traits verticaux. Le trait marqué 1:2 montre la résonance avec Neptune considérée comme la limite de la Ceinture principale de Kuiper.
Histogrammes edit
Les histogrammes montrent la population d’objets avec un paramètre donné (l'excentricité e; l'inclinaison i et demi axe majeur a) à l’intérieur d’un intervalle. Les populations sont exprimées en % du nombre total des objets considérés (axe vertical)
- pour l’inclinaison i, l’intervalle est de 5o, c. à. d. le premier bar montre le pourcentage d’objets avec i entre 0 et 5o, le suivant entre 5 et 10o etc.
- pour l’excentricité e, l’intervalle est de 0,1 c. à. d. le premier bar montre le pourcentage d’objets avec e entre 0 et 0,1 (orbites relativement circulaires)
- pour le demi axe a, l’intervalle est de 2ua c. à. d. le premier bar montre le pourcentage d’objets avec e entre 10 et 12ua.
Source des donnés edit
La base de donnés MPCORB au 14 Février 2006.
Licensing edit

|
Permission is granted to copy, distribute and/or modify this document under the terms of the GNU Free Documentation License, Version 1.2 or any later version published by the Free Software Foundation; with no Invariant Sections, no Front-Cover Texts, and no Back-Cover Texts. A copy of the license is included in the section entitled GNU Free Documentation License. |
| This file is licensed under the Creative Commons Attribution-Share Alike 3.0 Unported license. | ||
| ||
| This licensing tag was added to this file as part of the GFDL licensing update. |
- You are free:
- to share – to copy, distribute and transmit the work
- to remix – to adapt the work
- Under the following conditions:
- attribution – You must give appropriate credit, provide a link to the license, and indicate if changes were made. You may do so in any reasonable manner, but not in any way that suggests the licensor endorses you or your use.
- share alike – If you remix, transform, or build upon the material, you must distribute your contributions under the same or compatible license as the original.
File history
Click on a date/time to view the file as it appeared at that time.
| Date/Time | Thumbnail | Dimensions | User | Comment | |
|---|---|---|---|---|---|
| current | 22:22, 20 February 2006 | | 800 × 400 (51 KB) | Eurocommuter~commonswiki (talk | contribs) | Distribution of Centaurs. Generated by a program written by Eurocommuter. === Main graph === The position of an object represents *its orbit’s semi-major axis '''a''' in AU (horizontal axis) *orbit’s inclination '''i''' in degr |
| 20:51, 16 February 2006 |  | 800 × 400 (30 KB) | Eurocommuter~commonswiki (talk | contribs) | Orbits distribution for Centaurs. Generated by a program written by Eurocommuter. |
You cannot overwrite this file.
File usage on Commons
The following page uses this file:
File usage on other wikis
The following other wikis use this file:
- Usage on fr.wikipedia.org