File:UmfrageHH2011.svg

Size of this PNG preview of this SVG file: 600 × 480 pixels. Other resolutions: 300 × 240 pixels | 960 × 768 pixels | 1,280 × 1,024 pixels | 2,560 × 2,048 pixels.
Original file (SVG file, nominally 600 × 480 pixels, file size: 18 KB)
Captions
Captions
Add a one-line explanation of what this file represents
Summary edit
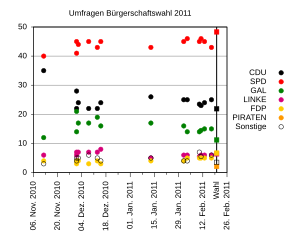
| Description | Gnuplot created SVG file of the poll history of the Hamburg election 2011 |
| Source | Own work |
| Author | MyName (Sig11 (talk)) |
Source code edit
# Ausgabedatei und -format
set output 'UmfrageHH2011.svg'
set terminal svg

# Datumformat
set locale 'de_DE.UTF-8'
set xdata time
set timefmt "%d.%m.%Y"
set format x "%d. %b. %Y"

# Titel
set title 'Umfragen Bürgerschaftswahl 2011'

# Achsen und Gitternetz
unset xlabel
set xtics out nomirror rotate 1 autofreq scale 1,0.5
set ytics out nomirror scale 0.5
set grid ytics
set yrange [0:50]

# Legende
set key outside right  center

set label "Wahl" at '20.02.2011',-3 right rotate by 90

# Plotten
plot 'hh11.dat' using 1:2 lt -1 pt 7 title 'CDU',\
     'hh11.dat' using 1:3 lt 1 pt 7 title 'SPD', \
     'hh11.dat' using 1:4 lt 2 pt 7 title 'GAL', \
     'hh11.dat' using 1:5 lt 12 pt 7 title 'LINKE', \
     'hh11.dat' using 1:6 lt 11 pt 7 title 'FDP', \
     '-' using  ('20.02.2011'):1 lt 7 pt 7 title 'PIRATEN',\
     'hh11.dat' using 1:7 lt -1 pt 6 title 'Sonstige',\
     '-' using  ('20.02.2011'):1 with impulses lt -1 lw 2 notitle ,\
     '-' using  ('20.02.2011'):1 lt -1 pt 5 notitle ,\
     '-' using  ('20.02.2011'):1 lt 1 pt 5 notitle ,\
     '-' using  ('20.02.2011'):1 lt 2 pt 5 notitle ,\
     '-' using  ('20.02.2011'):1 lt 12 pt 5 notitle ,\
     '-' using  ('20.02.2011'):1 lt 11 pt 5 notitle ,\
     '-' using  ('20.02.2011'):1 lt 7 pt 5 notitle ,\
     '-' using  ('20.02.2011'):1 lt -1 pt 4 notitle
#Dummy fuer die Erzeugung der Piraten in der Legende
70
e
#Dummy fuer die Erzeugung des Wahltermins
70
e
# Wahlergebnis CDU
21.9
e
# Wahlergebnis SPD
48.3
e
# Wahlergebnis GAL
11.2
e
# Wahlergebnis LINKE
6.4
e
# Wahlergebnis FDP
6.7
e
# Wahlergebnis PIRATEN
2.1
e
# Wahlergebnis Sonstige
3.5
e

set output
hh11.dat contains:
#              CDU     SPD     GAL  LINKE     FDP  Sonstige
17.02.2011      25      43      15      6       5       6
13.02.2011      24      45      15      6       5
11.02.2011      23      46      14.5    6       5       5.5
10.02.2011      23.5    45      14      5.5     5       7
03.02.2011      25      46      14      6       5       4
01.02.2011      25      45      16      6       4       4
13.01.2011      26      43      17      5       4       5
15.12.2010      24      45      16      8       3       4
13.12.2010      22      43      19      7       4       5
08.12.2010      22      45      17      7       3       6
02.12.2010      24      44      17      7       4       5
01.12.2010      28      45      14      6       3       4
01.12.2010      22      41      21      7       4       5
12.11.2010      35      40      12      6       4       3
==References==|
- Wahlrecht.de for the poll results
- Statistik Nord for the preliminary result of Feb. 23. Specifically the file INTBUEWA01.pdf.
Licensing edit
| I, the copyright holder of this work, release this work into the public domain. This applies worldwide. In some countries this may not be legally possible; if so: I grant anyone the right to use this work for any purpose, without any conditions, unless such conditions are required by law. |
File history
Click on a date/time to view the file as it appeared at that time.
| Date/Time | Thumbnail | Dimensions | User | Comment | |
|---|---|---|---|---|---|
| current | 15:31, 23 February 2011 | | 600 × 480 (18 KB) | Sig11 (talk | contribs) | Added preliminary result published on Feb. 23 on http://www.statistik-nord.de/wahlen/wahlen-in-hamburg/buergerschaftswahlen/2011/ |
| 14:36, 17 February 2011 |  | 600 × 480 (16 KB) | Sig11 (talk | contribs) | Added Feb. 17 poll. | |
| 21:16, 13 February 2011 |  | 600 × 480 (16 KB) | Sig11 (talk | contribs) | Added Feb 13. poll | |
| 10:59, 11 February 2011 |  | 600 × 480 (15 KB) | Sig11 (talk | contribs) | Fixed the columns of LINKE and FDP | |
| 10:53, 11 February 2011 |  | 600 × 480 (15 KB) | Sig11 (talk | contribs) | {{Information |Description=Gnuplot created SVG file of the poll history of the Hamburg election 2011 |Date= |Source={{own}} |Author= MyName (~~~) |Permission= |other_versions= }} == Source code == {{gnuplot}} <pre> # Ausgabedatei und -format set output |
You cannot overwrite this file.
File usage on Commons
There are no pages that use this file.