File:United States Commercial Paper 2001 to 2007.svg

Size of this PNG preview of this SVG file: 450 × 338 pixels. Other resolutions: 320 × 240 pixels | 639 × 480 pixels | 1,023 × 768 pixels | 1,280 × 961 pixels | 2,560 × 1,923 pixels.
Original file (SVG file, nominally 450 × 338 pixels, file size: 28 KB)
Captions
Captions
Add a one-line explanation of what this file represents
Summary edit
| Description |
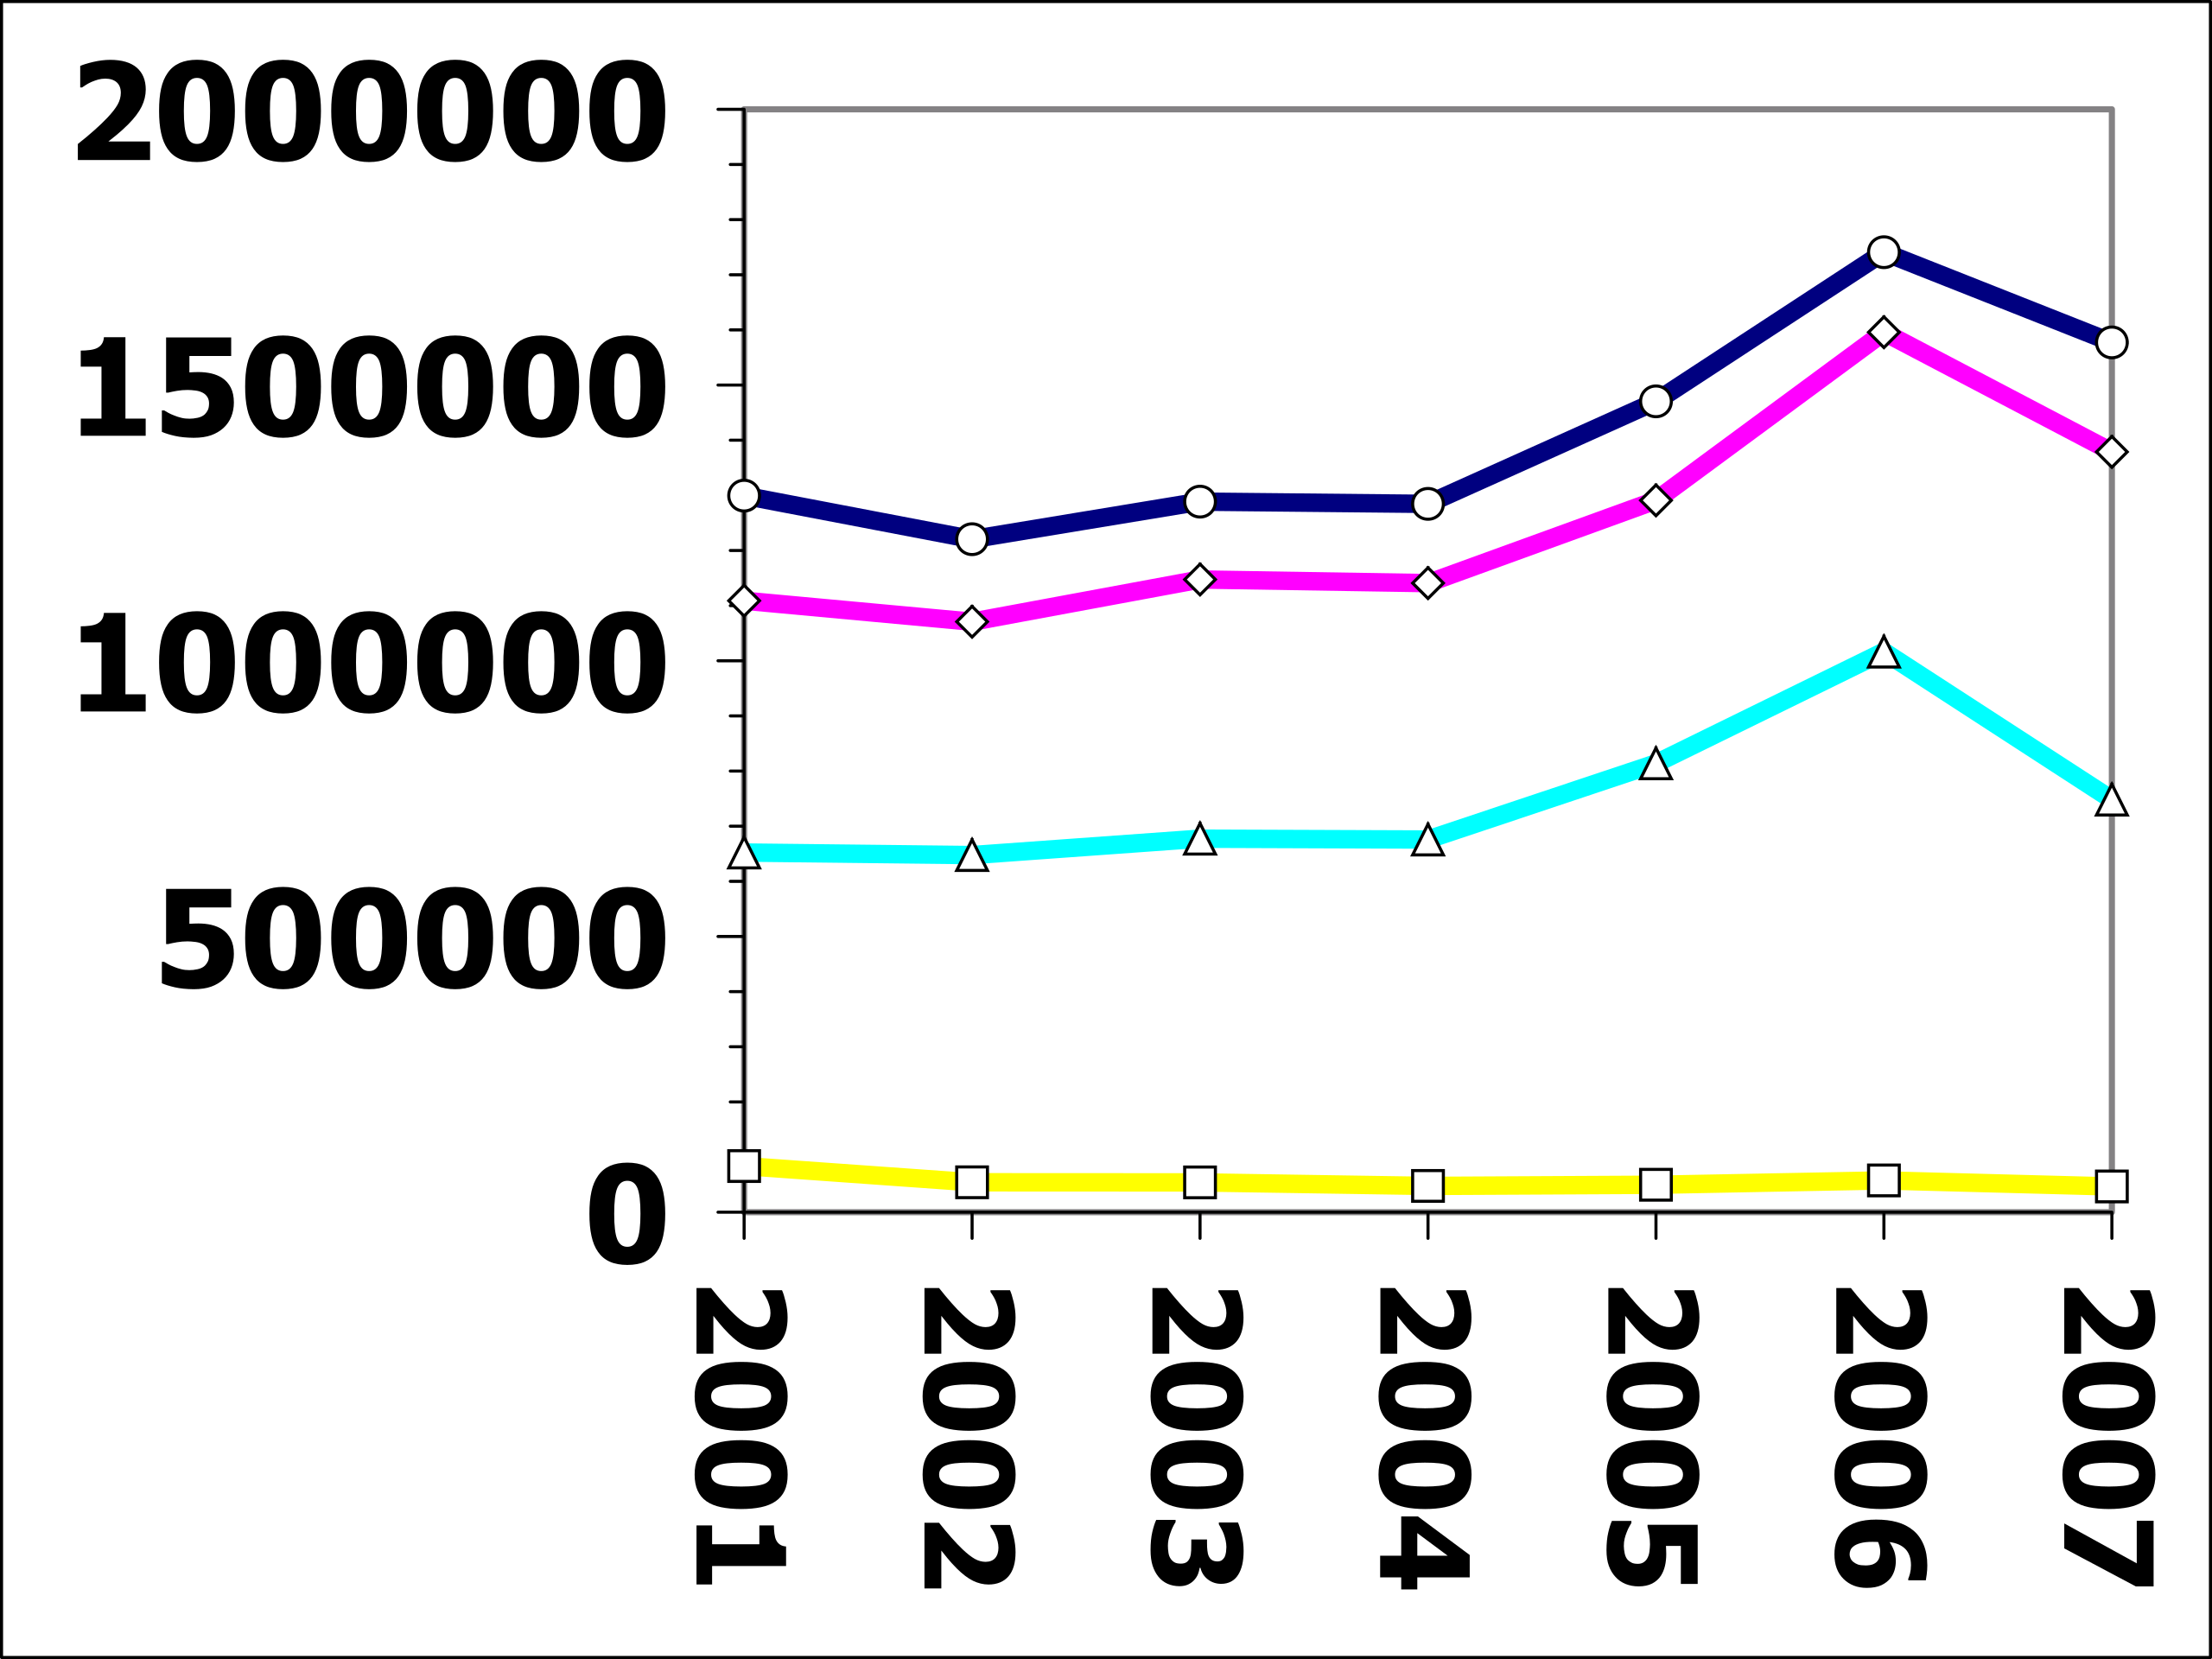
English: United States Commercial Paper outstanding at end of each year 2001 to 2007. Vertical scale shows debt in millions of dollars, horizontal scale shows years. All markers indicate commercial paper outstanding, maturing after December 31. Circles on blue line indicate Total commercial paper; triangles diamonds on pink line indicate SEC rule 2a-7 tier-1 commercial paper; triangles on blue line indicate Asset-backed commercial paper; squares on yellow line indicate SEC rule 2a-7 tier-2 commercial paper. No titles version. |
| Date | |
| Source | I, 84user, created this work using data from the United State's Federal Reserve Board Commercial Paper - last released Friday, October 31, 2008, chosen from [1], using Open Source Gnumeric 1.9.1 to produce the chart. |
| Author | 84user |
| Permission (Reusing this file) |
PD-SELF; Released into the public domain (by the author). |
| Other versions |
 |
Licensing edit
| This work has been released into the public domain by its author, 84user. This applies worldwide. In some countries this may not be legally possible; if so: |
Data used to create this in CSV format - click on the triangle to the right
"Series Description","Commercial Paper Outstanding; Maturing After December 31","Commercial Paper Outstanding, Tier-1; Maturing After December 31","Commercial Paper Outstanding, Tier-2; Maturing After December 31","Asset-backed Commercial Paper Outstanding; Maturing After December 31",,,,,,,
Unit:,Currency,Currency,Currency,Currency,,,,,,,
Multiplier:,1000000,1000000,1000000,1000000,,,,,,,
Currency:,USD,USD,USD,USD,,,,,,,
"Unique Identifier:",CP/OUTST_YREND/DTBSPCK_N.YREND.WW,CP/OUTST_YREND/DTBSPCKCT1_N.YREND.WW,CP/OUTST_YREND/DTBSPCKCT2_N.YREND.WW,CP/OUTST_YREND/DTBSPCKA_N.YREND.WW,,,,,,,
"Time Period",DTBSPCK_N.YREND.WW,DTBSPCKCT1_N.YREND.WW,DTBSPCKCT2_N.YREND.WW,DTBSPCKA_N.YREND.WW,,,"Year end",Total,,,
2001/12/26,1299452.8749,1108927.1468,83695.265639,652210.76176,,,2001/12/26,3144286.049099,,,
2002/12/25,1220454.657,1070818.6483,54253.38968,647632.06236,,,2002/12/25,2993158.75734,,,
2003/12/31,1288570.7327,1147390.78,54064.958144,677330.55626,,,2003/12/31,3167357.027104,,,
2004/12/29,1284525.8757,1140816.9591,47639.74655,675807.29289,,,2004/12/29,3148789.87424,,,
2005/12/28,1470437.4557,1290890.2504,49765.128876,813943.56633,,,2005/12/28,3625036.401306,,,
2006/12/27,1740912.6149,1595815.0403,57629.836117,1016505.4376,,,2006/12/27,4410862.928917,,,
2007/12/26,1577300.4541,1378786.6841,46707.354,748168.70307,,,2007/12/26,3750963.19527,,,
,,,,,,,,,,,
" Source","Year-end outstandings from Commercial Paper link on https://www.federalreserve.gov/datadownload/",,,,,,,,,,
File history
Click on a date/time to view the file as it appeared at that time.
| Date/Time | Thumbnail | Dimensions | User | Comment | |
|---|---|---|---|---|---|
| current | 14:37, 31 October 2008 | | 450 × 338 (28 KB) | 84user (talk | contribs) | {{Information |Description={{en|United States Commercial Paper outstanding at end of each year 2001 to 2007. Vertical scale shows debt in millions of dollars, horizontal scale shows years. All markers indicate commercial paper outstanding, maturing after |
You cannot overwrite this file.
File usage on Commons
The following page uses this file:
File usage on other wikis
The following other wikis use this file:
- Usage on en.wikipedia.org
- Usage on ga.wikipedia.org
- Usage on hi.wikipedia.org