File:WHO Covid 2020 Jan-Aug daily C Mauritania.pdf

Size of this JPG preview of this PDF file: 800 × 473 pixels. Other resolutions: 320 × 189 pixels | 640 × 378 pixels | 1,024 × 605 pixels | 1,280 × 756 pixels | 3,300 × 1,950 pixels.
Original file (3,300 × 1,950 pixels, file size: 21 KB, MIME type: application/pdf)
Captions
Captions
Add a one-line explanation of what this file represents
Summary edit
| Description |
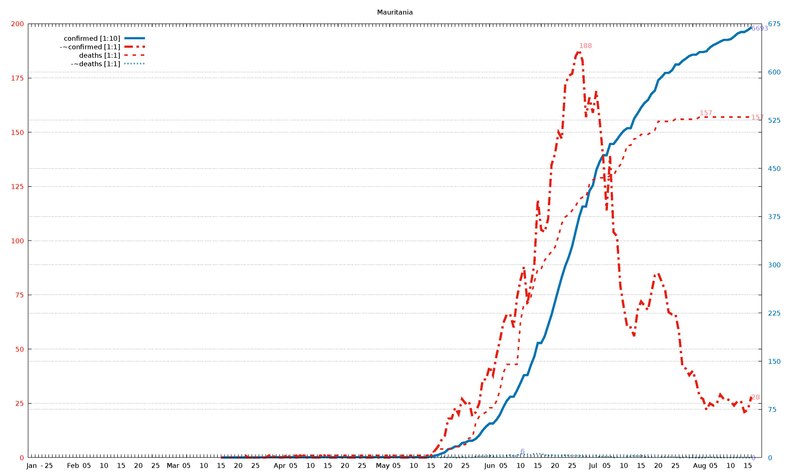
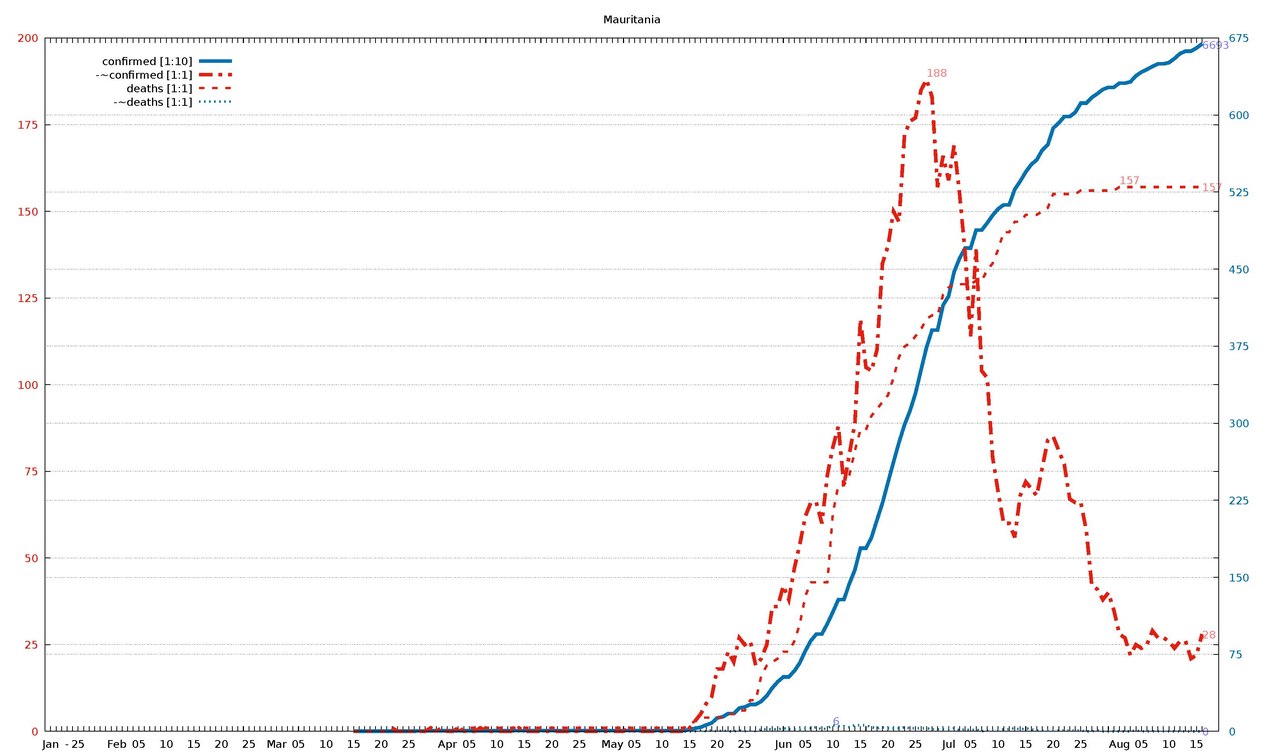
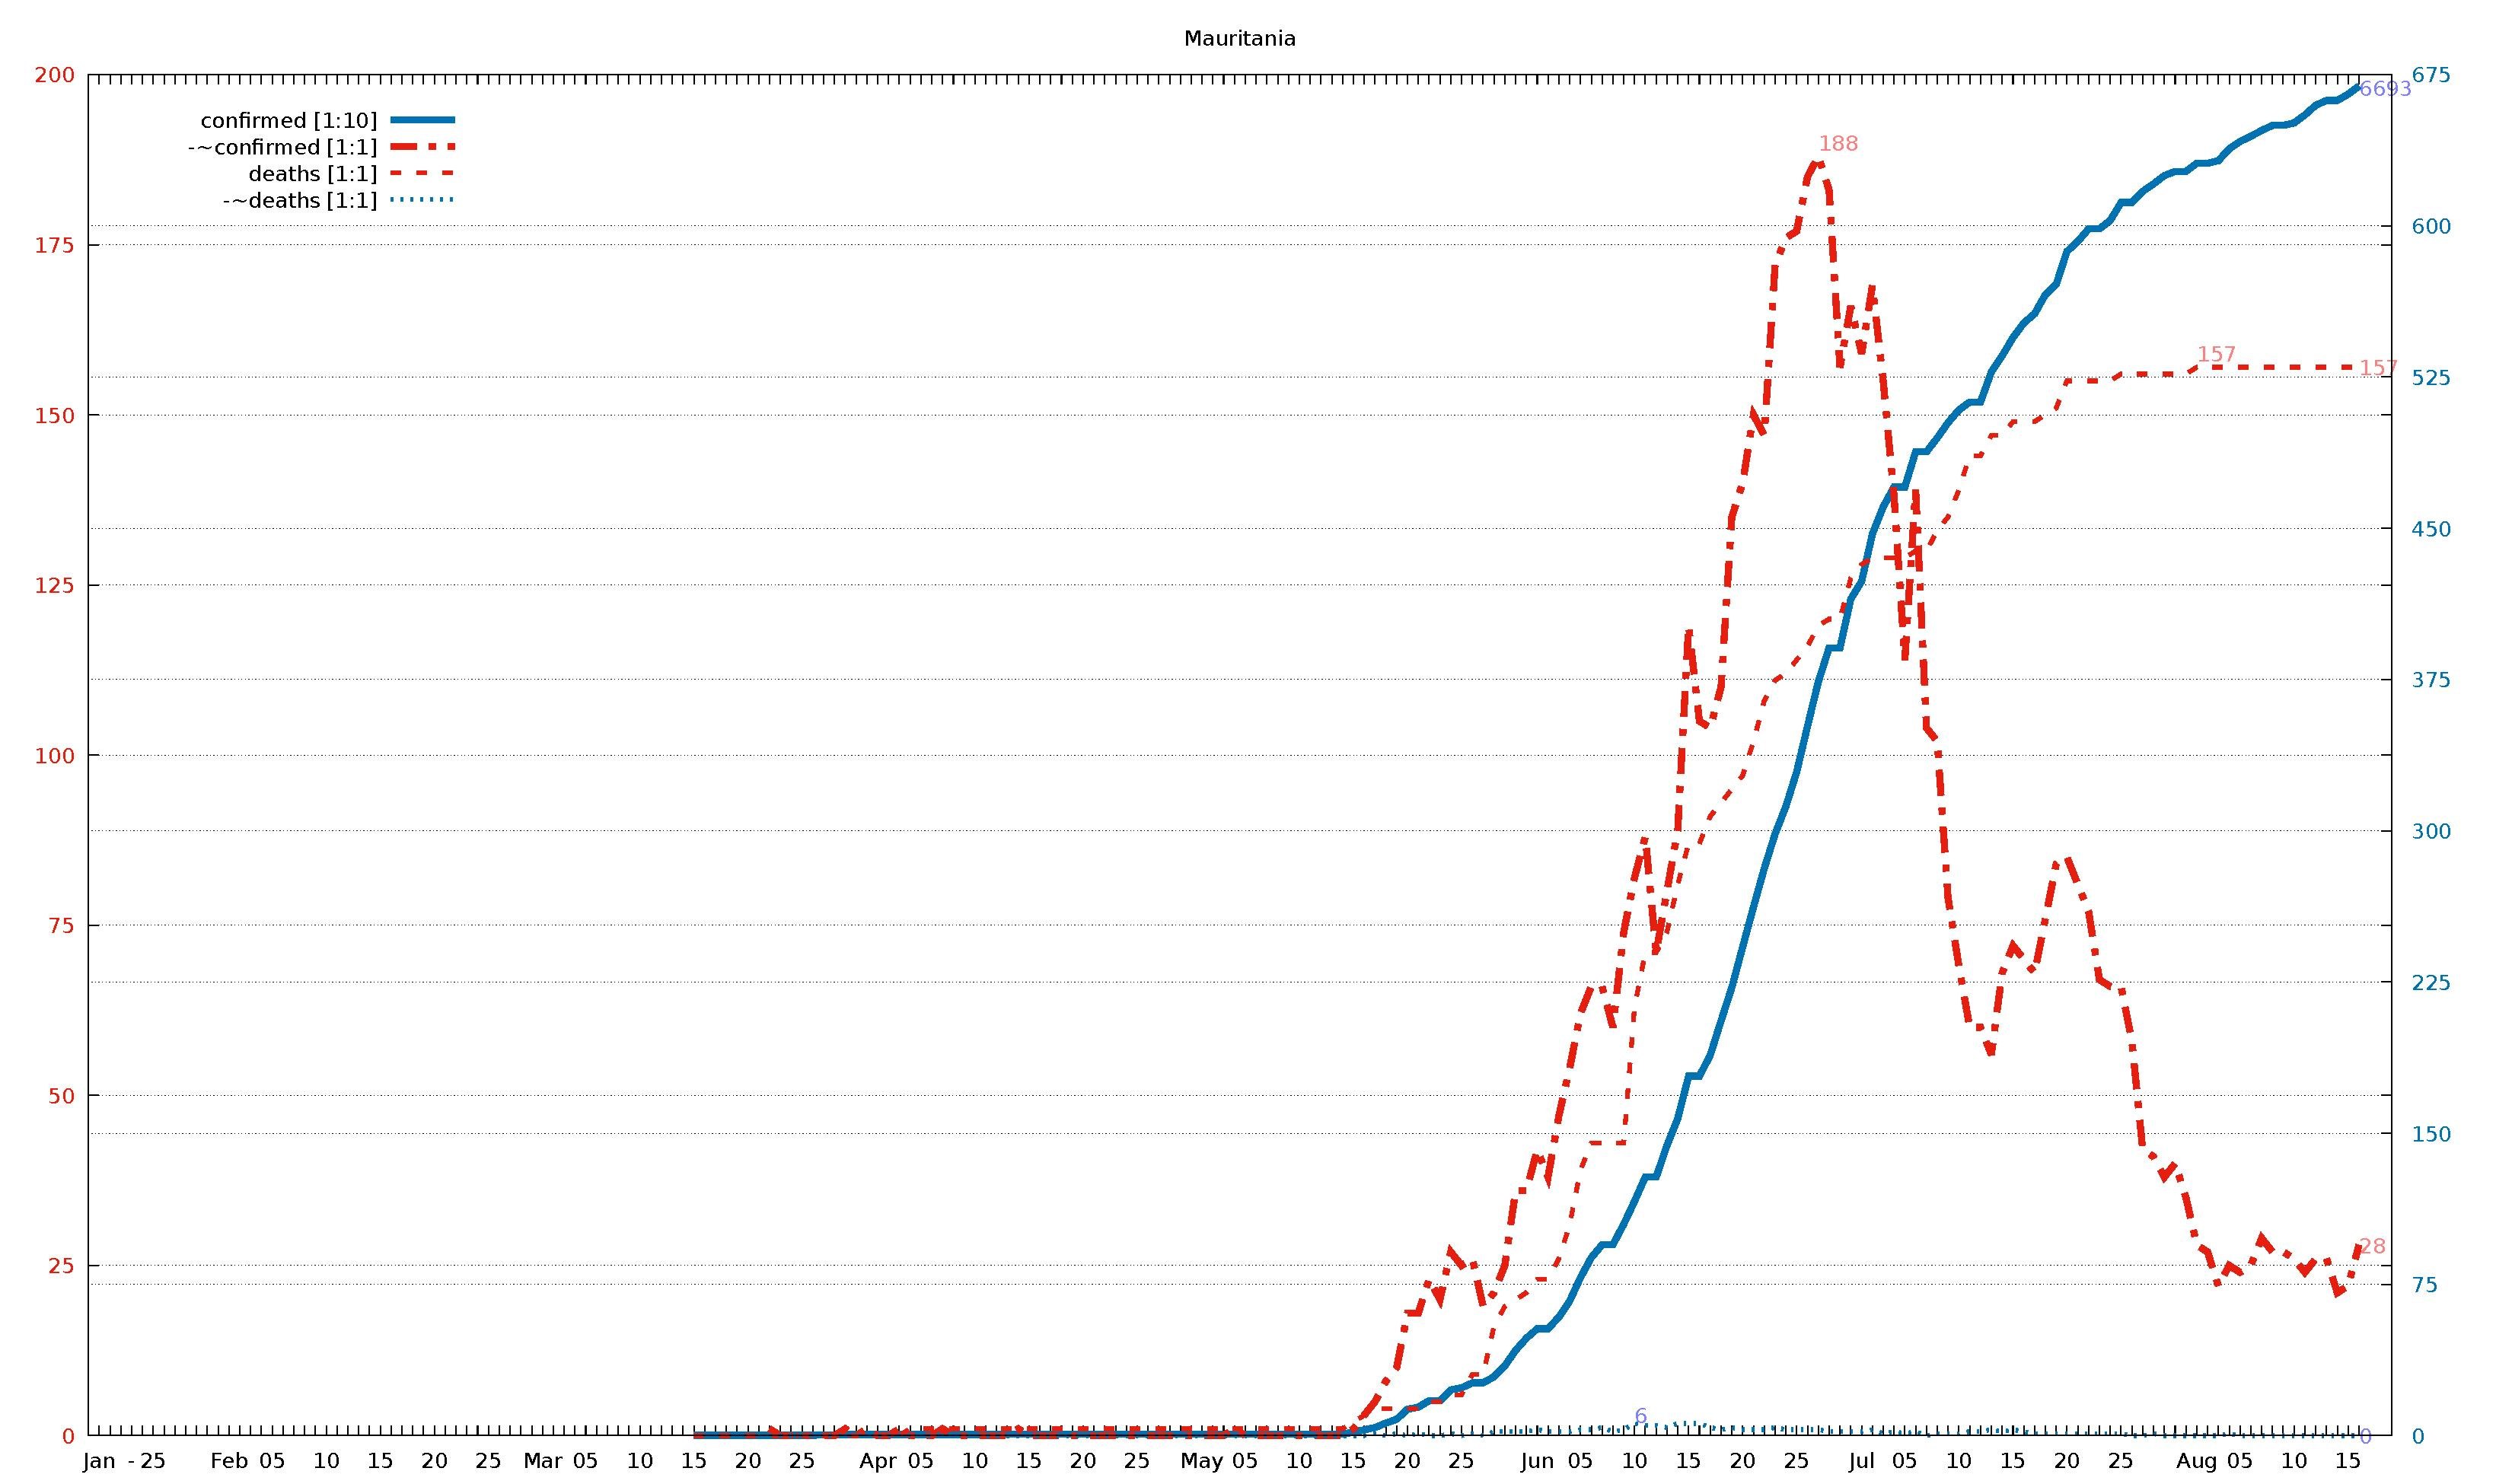
English: Diagram of WHO COVID-19 daily data (20 Jan - 16 Aug 2020) for "Total Confirmed Cases" (thick solid line), its smoothed increment (thick dash-dotted line), "Total Deaths" (thin dashed line) , and its smoothed increment (thin dotted line). Figures are taken from the available situation reports. Red and blue lines refer to the left and right vertical axis, respectively; the scaling factor for each curve is given in the legend. The horizontal axis starts on 20 Jan 2020 (situation report 1), and ends on 16 Aug 2020 (situation report 209). In the smoothed curves, for each day, 1/7 of the difference of the current day's figure and the figure a week ago is shown. For example, in situation report 115 (14 May 2020) and 121 (21 May 2020), there were 8676 and 5339 Total Confirmed Cases in Afghanistan, respectively, so the thick dash-dotted line passes through 477 = (8676-5339)/7 on 21 May.
For an overview of all related visualizations, and a more detailled description, see WHO Covid diagram set#Available country diagrams Jan-Aug 2020 (daily). |
| Date | |
| Source | Own work |
| Author | Jochen Burghardt |
Licensing edit
I, the copyright holder of this work, hereby publish it under the following license:
This file is licensed under the Creative Commons Attribution-Share Alike 4.0 International license.
- You are free:
- to share – to copy, distribute and transmit the work
- to remix – to adapt the work
- Under the following conditions:
- attribution – You must give appropriate credit, provide a link to the license, and indicate if changes were made. You may do so in any reasonable manner, but not in any way that suggests the licensor endorses you or your use.
- share alike – If you remix, transform, or build upon the material, you must distribute your contributions under the same or compatible license as the original.
Gnuplot source code edit
| Gnuplot source code |
|---|
set term pdf size 22,13
set term pdf font "sans,20"
set output "WHO_Covid_C_Mauritania.pdf"
set key autotitle columnhead
set termoption noenhanced
# (1) norm: 670 188 157 001
# (2) dist: 1,0:280 2,0:234 2,1:120
# (3,4) dist max: 280 1:188--0:670
# (4) right: 1 0 0 1
# (6,7) scMax: 200 675
# (8) scale: [1:10] [1:1] [1:1] [1:1]


set xrange [-1:212]
set yrange [0:200]
set y2range [0:675]
set xtics 3650,100
set ytics 25 textcolor "#e51e10"
set y2tics 75 textcolor "#0072b2"
set grid y y2

set title "Mauritania"

$data <<EOF
rep day "confirmed [1:10]" "-~confirmed [1:1]" "deaths [1:1]" "-~deaths [1:1]"
1	Jan	.	-	.	-
2	""	.	-	.	-
3	""	.	-	.	-
-	-	-	-	-	-
4	""	.	-	.	-
5	25	.	-	.	-
6	""	.	-	.	-
7	""	.	-	.	-
8	""	.	-	.	-
9	""	.	-	.	-
10	""	.	-	.	-
11	""	.	-	.	-
12	Feb	.	-	.	-
13	""	.	-	.	-
14	""	.	-	.	-
15	""	.	-	.	-
16	05	.	-	.	-
17	""	.	-	.	-
18	""	.	-	.	-
19	""	.	-	.	-
20	""	.	-	.	-
21	10	.	-	.	-
22	""	.	-	.	-
23	""	.	-	.	-
24	""	.	-	.	-
25	""	.	-	.	-
26	15	.	-	.	-
27	""	.	-	.	-
28	""	.	-	.	-
29	""	.	-	.	-
30	""	.	-	.	-
31	20	.	-	.	-
32	""	.	-	.	-
33	""	.	-	.	-
34	""	.	-	.	-
35	""	.	-	.	-
36	25	.	-	.	-
37	""	.	-	.	-
38	""	.	-	.	-
39	""	.	-	.	-
40	""	.	-	.	-
41	Mar	.	-	.	-
42	""	.	-	.	-
43	""	.	-	.	-
44	""	.	-	.	-
45	05	.	-	.	-
46	""	.	-	.	-
47	""	.	-	.	-
48	""	.	-	.	-
49	""	.	-	.	-
50	10	.	-	.	-
51	""	.	-	.	-
52	""	.	-	.	-
53	""	.	-	.	-
54	""	.	-	.	-
55	15	1	-	0	-
56	""	1	-	0	-
57	""	1	-	0	-
58	""	1	-	0	-
59	""	2	-	0	-
60	20	2	-	0	-
61	""	2	-	0	-
62	""	2	1	0	0
63	""	2	0	0	0
64	""	2	0	0	0
65	25	2	0	0	0
66	""	2	0	0	0
67	""	3	0	0	0
68	""	3	0	0	0
69	""	5	1	0	0
70	""	5	0	0	0
71	""	5	1	0	0
72	Apr	5	0	0	0
73	""	5	0	0	0
74	""	5	1	0	0
75	""	6	0	1	0
76	05	6	0	1	0
77	""	6	0	1	0
78	""	6	1	1	1
79	""	6	0	1	0
80	""	6	0	1	0
81	10	6	0	1	0
82	""	7	0	1	0
83	""	7	0	1	0
84	""	7	0	1	0
85	""	7	1	1	0
86	15	7	0	1	0
87	""	7	0	1	0
88	""	7	0	1	0
89	""	7	0	1	0
90	""	7	0	1	0
91	20	7	0	1	0
92	""	7	0	1	0
93	""	7	0	1	0
94	""	7	0	1	0
95	""	7	0	1	0
96	25	7	0	1	0
97	""	7	0	1	0
98	""	7	0	1	0
99	""	7	0	1	0
100	""	7	0	1	0
101	""	7	0	1	0
102	May	8	0	1	0
103	""	8	0	1	0
104	""	8	0	1	0
105	""	8	1	1	0
106	05	8	0	1	0
107	""	8	0	1	0
108	""	8	0	1	0
109	""	8	0	1	0
110	""	8	0	1	0
111	10	8	0	1	0
112	""	8	0	1	0
113	""	8	0	1	0
114	""	8	0	1	0
115	""	9	0	1	0
116	15	16	1	2	0
117	""	29	3	3	0
118	""	40	5	4	1
119	""	62	8	4	0
120	""	81	10	4	1
121	20	131	18	4	0
122	""	141	18	4	1
123	""	173	23	5	0
124	""	173	20	5	0
125	""	227	27	6	1
126	25	237	25	6	0
127	""	262	26	9	1
128	""	262	19	9	0
129	""	292	21	16	2
130	""	346	25	19	2
131	""	423	36	20	2
132	""	483	36	21	2
133	Jun	530	42	23	3
134	""	530	38	23	2
135	""	588	47	26	2
136	""	668	54	31	2
137	05	784	62	39	3
138	""	883	66	43	3
139	""	947	66	43	4
140	""	947	60	43	2
141	""	1049	74	43	3
142	10	1162	82	63	6
143	""	1283	88	71	5
144	""	1283	71	71	5
145	""	1439	80	74	4
146	""	1573	89	81	6
147	15	1783	119	87	6
148	""	1783	105	87	6
149	""	1887	104	91	4
150	""	2057	110	93	3
151	""	2223	135	95	4
152	20	2424	140	97	3
153	""	2621	150	102	3
154	""	2813	147	108	3
155	""	2984	172	111	4
156	""	3121	176	112	3
157	25	3292	177	114	3
158	""	3519	185	116	3
159	""	3739	188	119	3
160	""	3907	183	120	2
161	""	3907	157	120	2
162	""	4149	166	126	2
163	Jul	4237	159	128	2
164	""	4472	169	129	3
165	""	4606	155	129	1
166	""	4705	138	129	2
167	05	4705	114	129	1
168	""	4879	139	130	2
169	""	4879	104	130	0
170	""	4948	102	133	1
171	""	5024	79	135	1
172	10	5087	69	139	1
173	""	5126	60	144	2
174	""	5126	60	144	2
175	""	5275	56	147	3
176	""	5355	68	147	2
177	15	5446	72	149	3
178	""	5518	70	149	2
179	""	5564	68	149	1
180	""	5659	76	150	1
181	""	5710	84	151	1
182	20	5873	85	155	1
183	""	5923	81	155	1
184	""	5985	77	155	1
185	""	5985	67	155	1
186	""	6027	66	155	1
187	25	6116	66	156	1
188	""	6116	58	156	0
189	""	6171	42	156	0
190	""	6208	41	156	1
191	""	6249	38	156	0
192	""	6270	40	156	0
193	""	6270	35	156	0
194	Aug	6310	28	157	0
195	""	6310	27	157	0
196	""	6323	22	157	0
197	""	6382	25	157	1
198	05	6418	24	157	0
199	""	6444	25	157	0
200	""	6473	29	157	0
201	""	6498	27	157	0
202	""	6498	27	157	0
203	10	6510	26	157	0
204	""	6550	24	157	0
205	""	6598	26	157	0
206	""	6622	26	157	0
207	""	6622	21	157	0
208	15	6653	22	157	0
209	""	6693	28	157	0
EOF

# confirmed:
set label "6693   " at first 209,669*200/675   left back textcolor "#8080ff"
# -~confirmed:
set label "28     " at first 209, 28           left back textcolor "#ff8080"
set label "188    " at first 159,188        +2 left back textcolor "#ff8080"
# deaths:
set label "157    " at first 209,157           left back textcolor "#ff8080"
set label "157    " at first 194,157        +2 left back textcolor "#ff8080"
# -~deaths:
set label "0      " at first 209,  0*200/675   left back textcolor "#8080ff"
set label "6      " at first 142,  6*200/675+2 left back textcolor "#8080ff"

set multiplot
  plot $data using 0:($3/     10*200/675) with lines lc 6 lw 8 dt 1 title at 0.150, 0.920
replot $data using 0:($4/      1        ) with lines lc 7 lw 8 dt 4 title at 0.150, 0.902
replot $data using 0:($5/      1        ) with lines lc 7 lw 5 dt 2 title at 0.150, 0.884
replot $data using 0:($6/      1*200/675) with lines lc 6 lw 5 dt 3 title at 0.150, 0.866

# plot hor axis calendar
replot $data using 0:(0):xticlabel(2) with lines
|
File history
Click on a date/time to view the file as it appeared at that time.
| Date/Time | Thumbnail | Dimensions | User | Comment | |
|---|---|---|---|---|---|
| current | 19:21, 24 September 2020 |  | 3,300 × 1,950 (21 KB) | Jochen Burghardt (talk | contribs) | =={{int:filedesc}}== {{Information |description={{en|1=Diagram of WHO COVID-19 daily data (20 Jan - 16 Aug 2020) for ''"Total Confirmed Cases"'' (thick solid line), its smoothed increment (thick dash-dotted line), ''"Total Deaths"'' (thin dashed line), and its smoothed increment (thin dotted line); see File:WHO_Covid_2020_Jan-Aug_daily_C_Afghanistan.pdf for details.}} |date=2020-09-24 |source={{own}} |author=Jochen Burghardt |permission= |other_versions=[[:File:... |
You cannot overwrite this file.
File usage on Commons
There are no pages that use this file.