Management diagram
Management diagrams are diagrams concerning management, business and/or organization.

Organizational structuring edit
Organization charts edit
- See also Organizational chart


Organization models edit
-
 Galbraith's Star Model of organizational design, 1970s
 -
 Minzberg's organigram, 1980s
 -
 Porter's Value chain model, 1980s
 -
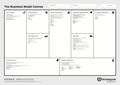 Business Model Canvas, 2000s


See also edit
Project scheduling edit
See Category:Project scheduling
Gantt charts edit
A Gantt chart is a type of bar chart, that illustrates a project schedule. Gantt charts illustrate the start and finish dates of the terminal elements and summary elements of a project. See Category:Gantt charts


PERT charts edit
The Program Evaluation and Review Technique, commonly abbreviated PERT, is a model for project management designed to analyze and represent the tasks involved in completing a given project. See Category:PERT charts


See also edit
Decision making edit
Ishikawa diagrams edit
Ishikawa diagram, also called fishbone diagram or and cause-and-effect diagram. See Category:Ishikawa diagrams
-
 Principle
 -
 Simple diagrams
 -
 More complex diagram


Product timelines edit
Product timelines are product-related timelines. See Category:Product timelines
-
 Boeing company development
 -
 Timeline of Hasselblad cameras
 -
 Timeline of iPod models


Simulation edit
See Systems dynamics
See also edit
Business process modeling edit
Business Process Modeling (BPD) in systems engineering and software engineering is the activity of representing processes of an enterprise, so that the current process may be analyzed and improved, see Category:Business process modeling
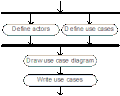
Activity diagrams edit
An activity diagram shows a sequence of activities. See Category:Activity diagrams
-
 A diagram showing how CUPS works
 -
 Controled process chain
 -


Process-data diagram edit
Process-data diagrams describe process and data, that act as output of these processes. See Category:Process-data diagram
-
 Meta-process model principles
 -
 Meta concept model principles
 -
 Process-data diagrams
 -
 Acquisition Initiation Process-Data Diagrams


Unified Modeling Language edit
Unified Modeling Language (UML) is a standardized visual specification language for object modeling in the field of software engineering. See Category:UML


See also edit
Enterprise modelling edit
Quality control edit
See also : Category:Quality control
See also edit
- More specific categories
many people get mad at this because it looks like a pentogram