Category:Agricultural maps of the world
Subcategories
This category has the following 4 subcategories, out of 4 total.
S
- Soil science maps of the world (65 F)
Y
- Yield maps of the world (8 F)
Media in category "Agricultural maps of the world"
The following 200 files are in this category, out of 344 total.
(previous page) (next page)-
 The Harmsworth atlas and Gazetter 1908 (135852847).jpg 6,366 × 9,572; 54.49 MB
-
 2004buffalo.PNG 1,425 × 625; 57 KB
-
 2005apple.PNG 1,425 × 625; 59 KB
-
 2005apricot.PNG 1,425 × 625; 61 KB
-
 2005artichoke.png 800 × 351; 86 KB
-
 2005barley.PNG 800 × 351; 78 KB
-
 2005chickpea.PNG 1,425 × 625; 57 KB
-
 2005clove.PNG 1,425 × 625; 57 KB
-
 2005cottonseed.PNG 1,425 × 625; 59 KB
-
 2005gdpAgricultural.PNG 1,425 × 625; 63 KB
-
 2005lemon and lime.PNG 1,425 × 625; 61 KB
-
 2005onion and shallot.PNG 1,425 × 625; 61 KB
-
 2005tomato.PNG 1,425 × 625; 60 KB
-
 2006palm oil.PNG 1,425 × 625; 58 KB
-
 2012 cocoa bean output.png 1,425 × 625; 51 KB
-
 2012apricot.png 1,425 × 625; 71 KB
-
 2012lemon and lime.png 1,425 × 625; 72 KB
-
 2012pear.png 1,425 × 625; 45 KB
-
 2012quince.png 1,425 × 625; 63 KB
-
 2013palm oil.png 1,425 × 625; 46 KB
-
 2013soybean.png 1,425 × 625; 50 KB
-
 30 cropwatch countries.png 1,369 × 546; 266 KB
-
 Acute food insecurity forecast for 2020 including coronavirus famines.svg 2,754 × 1,398; 1.22 MB
-
 Agricultural Map by Whittlesey, D.S.png 1,179 × 625; 164 KB
-
 Agricultural value map 1970-2008.gif 800 × 359; 1,017 KB
-
 Agricultural water as a share of total water withdrawals, OWID.svg 850 × 600; 140 KB
-
 Agricultural water withdrawals, OWID.svg 850 × 600; 141 KB
-
 Agricultural-land (OWID 0024).png 850 × 600; 97 KB
-
 Agriculture 1967 - part 1.jpg 4,364 × 2,912; 1.65 MB
-
 Agriculture 1967 - part 2.jpg 4,344 × 2,913; 1.63 MB
-
 Agriculture 1967 - part 3.jpg 4,256 × 2,904; 1.59 MB
-
 Agriculture 1967 - part 4.jpg 2,157 × 2,889; 839 KB
-
 Agriculture Beginning.png 1,357 × 628; 21 KB
-
 Agriculture orientation index for government expenditures, OWID.svg 850 × 600; 140 KB
-
 Agriculture value added per worker, OWID.svg 850 × 600; 141 KB
-
 Agriculture-orientation-index.png 3,400 × 2,400; 831 KB
-
 Agriculture-share-gdp (OWID 0017).png 850 × 600; 99 KB
-
 Alfalfaoutput.png 1,600 × 960; 464 KB
-
 Antimicrobial consumption per country in 2020 and 2030.png 2,250 × 887; 579 KB
-
 Appleoutput-fr.png 1,600 × 960; 473 KB
-
 Appleoutput.png 1,600 × 960; 477 KB
-
 ArecaYield.png 1,600 × 960; 451 KB
-
 Average Income of small-scale food producers.png 3,400 × 2,400; 726 KB
-
 Average-farm-size (OWID 0085).png 850 × 600; 93 KB
-
 Bambaraoutput.png 1,600 × 960; 476 KB
-
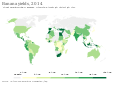 Banana yields, OWID.svg 850 × 600; 140 KB
-
 Bean belt (top 20 coffee producers 2011).svg 914 × 403; 1.32 MB
-
 Biofuel-energy-production.svg 850 × 600; 168 KB
-
 BlueberryYield.png 1,600 × 960; 433 KB
-
 Braziloutput.png 1,600 × 960; 429 KB
-
 Broadbean Yield.png 1,600 × 960; 468 KB
-
 Cabbageoutput.png 1,600 × 960; 550 KB
-
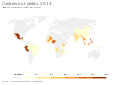 Cashew nut yields, OWID.svg 850 × 600; 147 KB
-
 CashewYield.png 1,600 × 960; 430 KB
-
 Cattle meat per animal, OWID.svg 850 × 600; 140 KB
-
 Cattle-livestock-count-heads.png 3,400 × 2,400; 811 KB
-
 Cereal yield, OWID.svg 850 × 600; 140 KB
-
 CherryYield.png 1,600 × 960; 450 KB
-
 Chicken meat production, OWID.svg 850 × 600; 140 KB
-
 Chicken meat yields per animal, OWID.svg 850 × 600; 139 KB
-
 Cocoa bean production, OWID.svg 850 × 600; 139 KB
-
 Cocoa bean yields, OWID.svg 850 × 600; 142 KB
-
 Coffee bean production, OWID.svg 850 × 600; 140 KB
-
 Coffee bean yields, OWID.svg 850 × 600; 140 KB
-
 Commercial grain farming.jpg 527 × 267; 42 KB
-
 CottonYield.png 1,600 × 960; 470 KB
-
 Countries by apple production in 2016.png 6,114 × 2,885; 1.91 MB
-
 Countries by apricot production in 2016.png 6,103 × 3,018; 2.01 MB
-
 Countries by artichoke production in 2016.png 6,162 × 2,938; 1.93 MB
-
 Countries by avocado production in 2016.png 6,158 × 3,047; 1.98 MB
-
 Countries by avocado production in 2020.png 6,820 × 3,213; 3.16 MB
-
 Countries by barley production in 2016.png 6,460 × 3,377; 2.18 MB
-
 Countries by cherry production in 2016.png 6,345 × 3,435; 2.25 MB
-
 Countries by cherry production in 2020.png 6,828 × 3,084; 2.99 MB
-
 Countries by coconut production in 2016.png 6,256 × 3,356; 1.9 MB
-
 Countries by coconut production in 2020.png 6,833 × 3,187; 3.14 MB
-
 Countries by cucumber production in 2016.png 6,248 × 3,446; 2 MB
-
 Countries by cucumber production in 2020.png 6,857 × 3,252; 3.14 MB
-
 Countries by eggplant production in 2016.png 6,115 × 3,042; 2.06 MB
-
 Countries by eggplant production in 2020.png 6,826 × 3,196; 3.19 MB
-
 Countries by garlic production in 2016.png 6,152 × 3,167; 2.13 MB
-
 Countries by garlic production in 2020.png 6,811 × 3,178; 3.15 MB
-
 Countries by grape production in 2016.png 6,139 × 3,031; 2.13 MB
-
 Countries by grape production in 2020.png 6,838 × 3,129; 3.18 MB
-
 Countries by irrigated land area in 2012.png 6,194 × 3,560; 2.13 MB
-
 Countries by onion production in 2016.png 6,124 × 2,936; 2.04 MB
-
 Countries by papaya production in 2016.png 6,150 × 3,197; 2.02 MB
-
 Countries by papaya production in 2020.png 6,815 × 3,197; 3.12 MB
-
 Countries by pear production in 2016.png 6,131 × 3,029; 2.02 MB
-
 Countries by pear production in 2020.png 6,815 × 3,194; 3.14 MB
-
 Countries by pineapple production in 2016.png 6,255 × 3,253; 1.9 MB
-
 Countries by pineapple production in 2020.png 6,817 × 3,204; 3.09 MB
-
 Countries by plum and sloe production in 2016.png 6,157 × 2,964; 2.05 MB
-
 Countries by potato production in 2016.png 6,247 × 3,448; 2.01 MB
-
 Countries by potato production in 2020.png 6,817 × 3,182; 3.12 MB
-
 Countries by soybean production in 2016.png 6,325 × 3,414; 2.49 MB
-
 Countries by soybean production in 2020.png 6,810 × 3,195; 3.22 MB
-
 Countries by Vegetable Production.png 6,460 × 3,403; 1.96 MB
-
-
 Countries with most Poles.png 6,421 × 3,326; 1.58 MB
-
 Crop-Agicultural-Biome-Earth.png 1,119 × 608; 148 KB
-
 Cropland Area (2021).svg 512 × 286; 3.68 MB
-
 Cultivo trigo.jpg 551 × 311; 31 KB
-
 Cumulative-co2-land-use (OWID 0216).png 850 × 600; 109 KB
-
 DateYield.png 1,600 × 960; 423 KB
-
 Eggplantoutput.png 1,600 × 960; 467 KB
-
 Eggs per bird, OWID.svg 850 × 600; 141 KB
-
 Employment in agriculture (% of total employment), OWID.svg 850 × 600; 140 KB
-
 Excess-nitrogen-per-hectare (OWID 0342).png 850 × 600; 119 KB
-
 Excess-phosphorous (OWID 0340).png 850 × 600; 117 KB
-
 Excess-phosphorous-per-hectare (OWID 0341).png 850 × 600; 110 KB
-
 Food Insecurity Hotspots Data Set, v1 (2009-2019) (50494372908).jpg 3,117 × 2,465; 828 KB
-
-
 FysiekeWaterschaarste.FAO2011.jpg 640 × 314; 98 KB
-

-

-
 Global land cover by silicon accumulating crops.png 2,003 × 1,124; 503 KB
-

-
 Global map of potential onshore marine microalgae protein production.jpg 1,430 × 1,754; 507 KB
-
 Groundnut yield, OWID.svg 850 × 600; 148 KB
-
 Größer.JPG 1,855 × 856; 201 KB
-
 GWC members map.png 448 × 285; 44 KB
-
 HeroinWorld-bn.svg 855 × 433; 1.76 MB
-
 HeroinWorld-He.svg 512 × 259; 812 KB
-
 Hopoutput.png 1,600 × 960; 439 KB
-
 How Will We Sustain a More Populated Planet? (6350003441).jpg 7,680 × 4,320; 13.94 MB
-
 International coffee organisation.svg 940 × 415; 1.72 MB
-

-
-
 KarteTabakernteWelt.png 1,357 × 628; 25 KB
-
 KarteSojabohnenerzeugung.png 1,357 × 628; 25 KB
-
 KolanutYield.png 1,600 × 960; 401 KB
-
 Kraje produkujące chmiel.jpg 1,661 × 832; 821 KB
-
 Lange diercke sachsen erdkarten verbreitung wichtiger nutzpflanzen.jpg 2,541 × 1,003; 912 KB
-
 Lentiloutput.png 1,600 × 960; 445 KB
-
-
 Mais Ursprung Verbreitung.JPG 3,000 × 1,759; 299 KB
-
 Maize production, OWID.svg 850 × 600; 140 KB
-
 Maize yields, OWID.svg 850 × 600; 140 KB
-
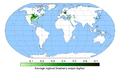
 Major Agricultural Regions 12.jpg 5,494 × 2,640; 1.74 MB
-
 Map of papaya output in 2005.png 1,425 × 625; 35 KB
-
 Map of tea producing countries 2012-2013.svg 863 × 443; 1.68 MB
-
-
 Mapa Agricultura mundo.png 1,179 × 625; 269 KB
-

-

-
 Meat and Dairy CO2 Emissions - 20 largest emitters.png 2,066 × 1,351; 398 KB
-
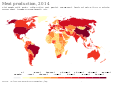 Meat production, OWID.svg 850 × 600; 142 KB
-
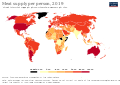
 Meat supply per person, OWID.svg 850 × 600; 141 KB
-
 Meat Supply per Person.svg 850 × 600; 164 KB
-
 Meat-production-tonnes (OWID 0662).png 850 × 600; 110 KB
-
 Methane-emissions-agriculture (OWID 0666).png 850 × 600; 102 KB
-
-
 Milk per animal, OWID.svg 850 × 600; 140 KB
-
 Milk production, OWID.svg 850 × 600; 140 KB
-
 Millet-yield (OWID 0658).png 850 × 600; 88 KB
-
 Milletoutput.png 1,600 × 960; 470 KB
-
 Names for tea.png 1,042 × 500; 156 KB
-
 Nitrogen-inputs-per-hectare (OWID 0624).png 850 × 600; 108 KB
-
 Nitrogen-use-efficiency (OWID 0623).png 850 × 600; 112 KB
-

-
 Number of accessions of plant genetic resources secured in conservation facilities.png 3,400 × 2,400; 844 KB
-
 Nápor na vodní zdroje v důsledku farmaření.jpg 601 × 334; 31 KB
-
 OatsYield.png 1,600 × 960; 513 KB
-
 Okraoutput.png 1,600 × 960; 430 KB
-
 OnionProduction2012.jpg 3,509 × 2,197; 734 KB
-
 Orange production, OWID.svg 850 × 600; 140 KB
-
 Orange yields, OWID.svg 850 × 600; 140 KB
-
 Origins and primary regions of diversity of selected major agricultural crops worldwide.pdf 11,810 × 8,352; 7.51 MB
-
 Palm-oil-yields (OWID 0680).png 850 × 600; 85 KB
-
 PapayaYield.png 1,490 × 908; 471 KB
-
 PaullHennig2016WorldMap.OAha.CC-BY-4.0.jpg 3,800 × 1,814; 291 KB
-
 PaullHennig2019.OrganicAgriculture.jpg 3,500 × 1,750; 1.64 MB
-
 PaullHennig2020.BiodynamicsWorldMap.an.jpg 3,500 × 1,565; 1.62 MB
-
 Pea-production (OWID 0674).png 850 × 600; 93 KB
-
 Pea-yields (OWID 0673).png 850 × 600; 90 KB
-
 PeaYield.png 1,600 × 960; 436 KB
-
 Pesticide Use (2021).svg 512 × 286; 3.64 MB
-
 Phosphate application per hectare of cropland, OWID.svg 850 × 600; 141 KB
-
 Phosphorous-inputs-per-hectare (OWID 0850).png 850 × 600; 108 KB
-
 Pig meat per animal, OWID.svg 850 × 600; 140 KB
-
 Pigmeat-production-tonnes.png 3,400 × 2,400; 782 KB
-
 Planche IX - Culture de quelques plantes a farine - Liv4-Ch08.png 4,112 × 3,056; 2.68 MB
-
 Potato production, OWID.svg 850 × 600; 140 KB
-
 Potato yields, OWID.svg 850 × 600; 142 KB
-
 PotatoYield-fr.png 1,602 × 960; 612 KB
-
 PotatoYield.png 1,600 × 960; 550 KB
-
 Potential Global Distribution of Spotted Lanternfly.jpg 1,440 × 992; 160 KB
-
 Poultry meat per animal, OWID.svg 850 × 600; 140 KB
-
 Poultry-livestock-count (OWID 0814).png 850 × 600; 93 KB
-
 Poultry-yields-meat-per-animal (OWID 0813).png 850 × 600; 87 KB
-

-
-

-

-

-

-

-

-

.jpg)


.png)


.png)


.png)


.svg)


,_OWID.svg)


.svg)

.png)


,_OWID.svg)
.png)
.png)
.png)
_(50494372908).jpg)


.png)


.jpg)


.jpg)


.jpg)


.png)
.png)


.png)


.png)
.png)


.png)


.png)
.png)

.svg)

.png)


.png)
.png)

.png)
.jpg)
.jpg)
.jpg)
.jpg)
.jpg)
.jpg)
.jpg)
_in_Year_2_after_different_nuclear_war_soot_injections.webp)