Category:Air quality monitoring in the United States
Subcategories
This category has the following 3 subcategories, out of 3 total.
Media in category "Air quality monitoring in the United States"
The following 59 files are in this category, out of 59 total.
-

-

-
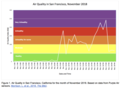
 2018-11-16-EPA-airnow-peak aqi sanfrancisco ca.jpg 525 × 400; 50 KB
-
 20180519 USGS Leilani Estates Hawaii Volcanic EruptionDSC 0411 medium.jpg 1,020 × 681; 150 KB
-
 20180524 MERS EPA Hawaii DSC 2188 medium.jpg 452 × 681; 91 KB
-
 Air Monitoring Penn Station.jpg 3,456 × 4,608; 3.64 MB
-
 Air Monitoring station, Reno, Nevada.jpg 3,052 × 2,227; 349 KB
-

-
 Air Quality Alert Sign (27613142285).jpg 3,590 × 2,185; 4.36 MB
-
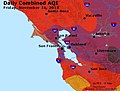
 Air quality in Bay Area during Camp Fire..png 1,487 × 1,091; 157 KB
-
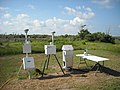
 Air quality monitoring station in DISH, Texas.jpg 4,256 × 2,832; 4.61 MB
-
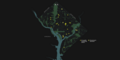 Air Quality Monitoring Stations in Washington D C (SVS5107 - dc air stations full 4320).png 4,320 × 2,160; 2.01 MB
-
 Air Quality Monitoring Stations in Washington D C (SVS5107).png 4,320 × 2,160; 1.96 MB
-
 AirqualityCA2018August.jpg 525 × 400; 65 KB
-
 Baseline meteorology and air quality in the Redding District - final report, v.1 (IA baselinemeteorol14ryka).pdf 1,287 × 1,685, 592 pages; 99.11 MB
-

-
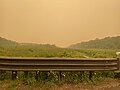 Canada wildfire smoke on June 7, 2023, on Pleasant Hill Road in Flanders, NJ.jpg 4,032 × 3,024; 2.04 MB
-
 Climate Change Impacts Clean Air (22978379391).jpg 800 × 800; 507 KB
-
 USCG Testing Air Quality On Unalaska.jpg 2,561 × 1,829; 2.69 MB
-
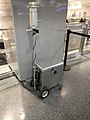
 EPA air monitoring equipment (4717896770).jpg 800 × 600; 86 KB
-
 EPA air sampling assembly (4717252707).jpg 800 × 600; 93 KB
-
 EPA Air Sampling Stations (4717252565).jpg 800 × 600; 94 KB
-
 EPA Air Sampling Stations along the Gulf coast (4717252539).jpg 800 × 600; 94 KB
-
 EPA Air Sampling Stations along the Gulf coast (4717252599).jpg 800 × 600; 111 KB
-
 EPA Sampling Locations May 4, 2010 (4611469199).jpg 3,300 × 2,550; 1.68 MB
-
 EPA TAGA Air Monitoring Locations June 1, 2010 (4712325843).jpg 3,300 × 2,550; 2.05 MB
-
 EPA TAGA Air Monitoring Locations June 11, 2010 (4712326081).jpg 2,550 × 3,300; 2.62 MB
-
 EPA TAGA Air Monitoring Locations June 13, 2010 (4712966336).jpg 3,300 × 2,550; 2.06 MB
-
 EPA TAGA Air Monitoring Locations June 2, 2010 (4712966070).jpg 2,550 × 3,300; 2.95 MB
-
 February 2001, Installing air monitoring equipment (5201417739).jpg 600 × 450; 43 KB
-
 June 3, Taga bus monitors air in Dauphin Island, Ala (4683065700).jpg 4,256 × 2,832; 2.11 MB
-
 June 4, Air monitoring efforts continue (4682437501).jpg 4,256 × 2,832; 751 KB
-
 June 4, Equipment along Grand Isle State Park, La (4683066928).jpg 4,256 × 2,832; 1.05 MB
-
 June 4, In a race against the rain (4683067150).jpg 2,832 × 4,256; 1.48 MB
-
 June 4, Maintaining monitoring equipment (4682437337).jpg 2,740 × 4,109; 1.01 MB
-
 June 4, Monitoring air quality along the Gulf coast (4683067068).jpg 4,288 × 2,848; 1.12 MB
-

-

-
 Mauna Loa Observatory.jpg 3,802 × 3,882; 2.07 MB
-
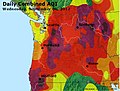 Peak AQI Washington and Oregon 20170906.jpg 525 × 400; 57 KB
-
 PLANE MONITORS SMOG OVER LOS ANGELES - NARA - 542672.jpg 3,000 × 2,043; 4.91 MB
-
 SignboardAirQualityHouston.JPG 2,272 × 1,704; 827 KB
-
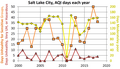 SLC AQI 2000-2018.png 1,773 × 1,022; 186 KB
-

-

-
 STAQS Air Quality Conceptual Illustrations (SVS14442 - AQ illustration 2 OZONE Text v01).jpg 3,840 × 2,500; 1.61 MB
-

-
 U.S. Air Quality Improvement - Atlanta (14505963062).jpg 1,920 × 1,200; 532 KB
-
 U.S. Air Quality Improvement - Chicago (14320503679).jpg 1,920 × 1,200; 335 KB
-
 U.S. Air Quality Improvement - Denver (14507104355).jpg 1,920 × 1,200; 397 KB
-
 U.S. Air Quality Improvement - Houston (14320655867).jpg 1,920 × 1,200; 269 KB
-
 U.S. Air Quality Improvement - LA-San Diego (14503709021).jpg 1,920 × 1,200; 294 KB
-
 U.S. Air Quality Improvement - NewYork (14507107455).jpg 1,920 × 1,200; 445 KB
-
 U.S. Air Quality Improvement - Northeast U.S 2005-2011. (14483906186).jpg 1,920 × 1,080; 201 KB
-
 U.S. Air Quality Improvement - Ohio River Valley 2005-2011 (14505662584).jpg 1,920 × 1,080; 274 KB
-
 U.S. Air Quality Improvement - Philadelphia (14320501688).jpg 1,920 × 1,200; 436 KB
-
 U.S. Air Quality Improvement - San Francisco (14320500668).jpg 1,920 × 1,200; 298 KB
-
 U.S. Air Quality Improvement - Tampa (14505751444).jpg 1,920 × 1,200; 180 KB
-
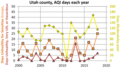 Utah county AQI 2000-2018.png 1,776 × 1,006; 193 KB


_ON_TOP_OF_FIREHOUSE_%5E13_AT_4750_BROADWAY_RECORDS_EMISSIONS_SUCH_AS_THOSE_FROM_REPUBLIC..._-_NARA_-_550277.jpg)
.jpg)


.png)
.png)

.jpg)

.jpg)

.jpg)
.jpg)
.jpg)
.jpg)
.jpg)
.jpg)
.jpg)
.jpg)
.jpg)
.jpg)
.jpg)
.jpg)
.jpg)
.jpg)
.jpg)
.jpg)
.jpg)


.jpg)
.jpg)
.jpg)
.jpg)
.jpg)
.jpg)
.jpg)
.jpg)
.jpg)
.jpg)
.jpg)
.jpg)
.jpg)
.jpg)
