Category:Biochemistry diagrams
Wikimedia category | |||||
| Upload media | |||||
| Instance of | |||||
|---|---|---|---|---|---|
| |||||
Subcategories
This category has the following 12 subcategories, out of 12 total.
Media in category "Biochemistry diagrams"
The following 200 files are in this category, out of 293 total.
(previous page) (next page)-
 201309 histone.png 400 × 400; 19 KB
-
 2504 Glycosis Overview.jpg 1,939 × 2,786; 1.04 MB
-
 625 Calcium Homeostasis.jpg 825 × 737; 333 KB
-
 800px-Enzymeactivesite ar.png 800 × 540; 104 KB
-
 800px-Enzymeactivesite.png 800 × 524; 173 KB
-
 A typical exometabolomics experiment.png 824 × 412; 75 KB
-
 Absorcio TSH.png 621 × 499; 32 KB
-
 Activin inhibin.png 1,403 × 521; 25 KB
-
 AGE a Eicosanoides.svg 960 × 760; 1.11 MB
-
 AHBV epsilon.jpg 644 × 1,010; 72 KB
-
 Allosteric comp inhib 1.svg 840 × 580; 29 KB
-
 Allosteric comp inhib 2.svg 840 × 580; 27 KB
-
 Allosterische Hemmung E-Coli.svg 512 × 453; 80 KB
-
 Alpha Helix Ribbon.svg 304 × 839; 140 KB
-
 Alternative Splicing.png 1,224 × 396; 13 KB
-
 Amino acids by property.jpg 2,000 × 2,000; 1.19 MB
-
 Antiport.gif 480 × 500; 49 KB
-
 Arbeitsschritte.png 243 × 413; 27 KB
-
 Arc Regulation.png 2,964 × 993; 214 KB
-
 Arc system in E.coli.png 713 × 625; 46 KB
-
 Arf mediated vesicle fission.png 1,064 × 349; 54 KB
-
 ATP-Synthase sl.svg 512 × 894; 14 KB
-
 ATP-Synthase.svg 512 × 894; 10 KB
-
 Autogenesis.jpg 1,291 × 711; 268 KB
-
 Background24.png 974 × 340; 87 KB
-
 Bacterial Protein synthesis.png 1,968 × 642; 211 KB
-
 Beta-e-beam-Gamma-X-ray-efficiency.jpg 4,961 × 3,071; 1.6 MB
-
 Beta-oxidacion.svg 1,195 × 703; 110 KB
-
 Bim regulation by USP27X.jpg 670 × 471; 53 KB
-
 Biochem1.jpg 1,152 × 648; 64 KB
-
 Biochemical Relationships in a Cell.png 1,011 × 521; 111 KB
-
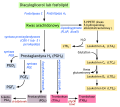
 Blood glucose control.png 1,679 × 781; 79 KB
-
 Botulinum toxin 3BTA.png 1,279 × 1,547; 1.17 MB
-
 BU Bio5.jpg 284 × 244; 73 KB
-
 Building blocks of life (without text).png 1,513 × 1,064; 250 KB
-
 Building blocks of life.png 1,513 × 1,064; 304 KB
-
 Building nucleic acids SVG.svg 512 × 388; 74 KB
-
 C2 Cycle.png 518 × 689; 74 KB
-
 C3 cycle.jpg 476 × 729; 72 KB
-
 CalciumRegulationInCardiacCell WP536.png 1,630 × 1,086; 154 KB
-
 Capture and release model for copper transfer from CCS to SOD1.png 417 × 275; 58 KB
-
 Catalización alfa-galactosidasa.png 743 × 221; 35 KB
-
 Catálisis.jpg 601 × 204; 15 KB
-
 CellRespiration (zh-cn).svg 1,052 × 744; 232 KB
-
 CellRespiration (zh-tw).svg 1,052 × 744; 202 KB
-
 CellRespiration-su.svg 1,052 × 744; 262 KB
-
 CellRespiration.svg 1,052 × 744; 261 KB
-
 Cellular Inositol Metabolism.JPG 960 × 720; 40 KB
-
 Cellular respiration lowchart (es).png 353 × 599; 15 KB
-
 Cellular respiration.gif 880 × 887; 80 KB
-
 Cellularrespiration.JPG 563 × 729; 36 KB
-
 CellularRespiration.png 415 × 401; 10 KB
-
 Centralny dogmat biologii molekularnej.png 1,300 × 966; 46 KB
-
 Chain (3).png 540 × 260; 13 KB
-
 Chlororespiration basics.jpg 1,651 × 1,187; 106 KB
-
 CHO-cycles ar.png 980 × 560; 24 KB
-
 CHO-cycles cz.png 2,307 × 1,508; 117 KB
-
 CHO-cycles cz.svg 2,384 × 1,684; 9 KB
-
 CHO-cycles de.png 980 × 560; 8 KB
-
 CHO-cycles en.png 980 × 560; 8 KB
-
 Citric acid cycle.jpg 960 × 717; 79 KB
-
 CnGRASP55domainsc.jpg 763 × 473; 112 KB
-
 Comp inhib.png 820 × 575; 42 KB
-
 Comp inhib.svg 840 × 580; 25 KB
-
 Competition Between Glycosylation and Phosphorylation of Proteins.tiff 413 × 718; 123 KB
-
 Complex III reaction pl.svg 1,872 × 981; 68 KB
-
 Complex III reaction pt.svg 1,872 × 981; 66 KB
-
 Complex IV pt.svg 987 × 1,122; 38 KB
-
 Conceptual TM6SF2 protein with phosphorylation sites.png 1,280 × 1,024; 419 KB
-
 Conformational change of troponin.JPG 832 × 360; 80 KB
-
 Conformational changes in ClpP upon ADEPs binding.png 852 × 489; 57 KB
-
 Coproporphyrinogen-III-synthesis-from-uroporphyrinogen-III.png 1,900 × 800; 29 KB
-
 CoreOligo.svg 2,258 × 1,236; 342 KB
-
 COTRANSPORTER.jpg 2,480 × 1,754; 355 KB
-
 Csacascasc.jpg 1,250 × 1,226; 1.64 MB
-
 DAF-16.jpg 1,366 × 768; 138 KB
-
 DHBV epsilon.png 745 × 682; 44 KB
-
 Diagram for Wikipedia Gel Page.pdf 1,275 × 1,650; 12 KB
-
 Directionality of DNA molecule.png 1,220 × 838; 128 KB
-
 DNA base pairing.svg 512 × 512; 291 KB
-
 DNA double helix grooves.svg 512 × 512; 143 KB
-
 DNA double helix.svg 512 × 512; 43 KB
-
 DNA template during transcription.png 3,128 × 1,482; 609 KB
-
 Domain structure of laminin.JPG 723 × 836; 46 KB
-
 EB1911 Piperine.jpg 899 × 293; 55 KB
-
 Edge of Interaction on Nucleoside.png 1,112 × 1,094; 113 KB
-
 EDMAN DEGRADATION.jpg 672 × 448; 32 KB
-
 EFA to Eicosanoids.svg 960 × 760; 169 KB
-
 Eicosanoid synthesis pl.svg 320 × 285; 307 KB
-
 Elektronen-getriebener Protonentransport.svg 512 × 230; 268 KB
-
 Elisa pośrednia i bezpośrednia.svg 800 × 400; 13 KB
-
 ELISPOT-en.png 517 × 404; 36 KB
-
 Els àcids grasos omega-3 i omega-6.pnj.jpg 853 × 460; 56 KB
-
 Els àcids grassos omega-3 i omega-6.jpg 844 × 468; 56 KB
-
 Environment.png 1,876 × 868; 46 KB
-
 Enzimműködés.jpg 800 × 346; 52 KB
-
 Esquema catabolismo.png 425 × 390; 29 KB
-
 Esquema fosforilación histonas.jpg 2,855 × 3,772; 1.83 MB
-
 Exon Shuffling.png 1,818 × 1,648; 1.43 MB
-
 Export of mature mRNA from the nucleus.png 806 × 338; 55 KB
-
 Extended Central Dogma with Enzymes.jpg 762 × 389; 124 KB
-
 FCFS.JPG 2,592 × 1,936; 1.62 MB
-
 Feedback Inhibition.jpg 578 × 365; 41 KB
-
 Feedback inhibition.svg 744 × 1,052; 96 KB
-
 Fermentacja.alkoholowa.svg 263 × 375; 274 KB
-
 Fermentacja.mleczanowa.svg 263 × 375; 269 KB
-
 Fluorescence Assisted Cell Sorting (FACS) A.jpg 2,028 × 1,593; 629 KB
-
 Fluorescence Assisted Cell Sorting (FACS) B.jpg 2,028 × 1,593; 626 KB
-
 FluoropyrimidineActivity WP1601.png 699 × 1,022; 69 KB
-
 Folate-methionine cycle.svg 800 × 484; 96 KB
-
 Formamide and urea as denaturants.svg 512 × 512; 215 KB
-
 Formation of disulphide covalent bonds.png 1,416 × 1,008; 150 KB
-
 Functional.jpg 640 × 400; 15 KB
-
 Funzioni del colesterolo.png 1,017 × 447; 10 KB
-
 G Protein Cycle.png 1,145 × 736; 8 KB
-
 G Protein Cycle.svg 1,146 × 736; 19 KB
-
 GAPS.png 764 × 379; 14 KB
-
 Ggn68 stk.svg 411 × 489; 208 KB
-
 Glicolise-gliconeogenese.png 689 × 951; 38 KB
-
 Glikoliza.svg 263 × 274; 240 KB
-
 Glikoliza2.png 1,899 × 3,826; 121 KB
-
 Globines humaines à la naissance.svg 800 × 610; 41 KB
-
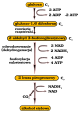
 Glucagon Activation.png 958 × 754; 101 KB
-
 Gluconeogenese Diagramm.png 404 × 669; 6 KB
-
 Glucólisis.png 3,028 × 1,470; 697 KB
-
 Glycolysis regul muscle.png 1,652 × 2,012; 43 KB
-
 Glycosylation of a polypeptide.png 2,098 × 720; 137 KB
-
 Glykogen-schema.png 796 × 510; 42 KB
-
 GPCR and itegrin signaling diagram.png 819 × 846; 355 KB
-
 Helicase Binding Domain of E. Coli.JPG 2,048 × 1,408; 213 KB
-
 Heme synthesis (hrv.).png 2,000 × 1,009; 84 KB
-
 Heme synthesis.png 550 × 278; 34 KB
-
 Heme synthesis.svg 551 × 278; 96 KB
-
 HHBV epsilon.jpg 713 × 663; 73 KB
-
 Hierarchyimage.jpg 589 × 450; 121 KB
-
 Hill reaction 1.png 454 × 221; 9 KB
-
 Ig genic domains.svg 460 × 1,457; 27 KB
-
 Immunoassay.svg 415 × 484; 22 KB
-
 Indirect ELISA.png 848 × 457; 21 KB
-
 Induced fit diagram (zh-cn).svg 648 × 253; 19 KB
-
 Induced fit diagram (zh-tw).svg 648 × 253; 16 KB
-
 Induced fit diagram cs.svg 648 × 253; 9 KB
-
 Induced fit diagram de.svg 648 × 253; 21 KB
-
 Induced fit diagram es.svg 648 × 253; 22 KB
-
 Induced fit diagram eu.svg 648 × 253; 16 KB
-
 Induced fit diagram fr.png 2,008 × 980; 144 KB
-
 Induced fit diagram id.svg 648 × 253; 122 KB
-
 Induced fit diagram pt.svg 648 × 253; 17 KB
-
 Induced fit diagram-tr.svg 648 × 253; 21 KB
-
 Induced fit diagram.svg 648 × 253; 21 KB
-
 InducedFit Enzyme Catalyst.png 824 × 371; 75 KB
-
 Inhibiteur incompetitif.png 133 × 345; 17 KB
-
 Inositol Trisphosphate 3-kinase isoforms table.JPG 960 × 720; 57 KB
-
 Insulin glucose metabolism ZP ml.svg 745 × 416; 22 KB
-
 Integrins.png 2,968 × 512; 173 KB
-
 Intron Splicing.png 1,861 × 2,117; 1.92 MB
-
 Irreversible inhibitors.png 885 × 362; 14 KB
-
 Katabolismus-schematisch.svg 425 × 390; 14 KB
-
 Kdp operon.jpg 418 × 73; 27 KB
-
 Kdp phosphorelay system.jpg 427 × 266; 76 KB
-
 Kdp phosphorelay.png 1,042 × 632; 55 KB
-
 Kdp phosphorelay1.png 1,042 × 632; 90 KB
-
 KdpFABC Operon.jpg 1,360 × 557; 21 KB
-
 Kinase activity control.png 2,049 × 1,052; 244 KB
-
 Kissing-loop-interaction.jpg 702 × 257; 44 KB
-
 Kissing-loop.jpg 702 × 257; 46 KB
-
 Kompetitive Inhibition von Enzymen.svg 134 × 284; 16 KB
-
 Komplex III.png 833 × 825; 27 KB
-
 La bilirubina i els seus productes de degradació.jpg 1,889 × 2,605; 358 KB
-
 La lanzadera de citrato.JPG 962 × 647; 40 KB
-
 Les diabetes.png 2,479 × 3,508; 365 KB
-
 Light Absorption.png 1,098 × 624; 26 KB
-
 LipidASynth1.gif 1,941 × 898; 21 KB
-
 LipidASynth2.gif 2,283 × 1,298; 34 KB
-
 Liquid extraction111.png 694 × 861; 37 KB
-
 Lock and key model.png 968 × 493; 20 KB
-
 LPS-ru.svg 441 × 1,014; 79 KB
-
 LPS.svg 441 × 1,014; 84 KB
-
 Matrix Metalloproteinases.png 728 × 434; 45 KB
-
 Mechanism of a Potassium Channel.jpg 1,202 × 350; 211 KB
-
 Mechanism of Intron Excision by Splicesome.jpg 2,592 × 1,936; 1.7 MB
-
 Metabolism 890px.png 890 × 645; 182 KB
-
 Metabolism sketch.svg 512 × 700; 149 KB
-
 Michaelis menten equation.jpg 429 × 222; 16 KB
-
 Mitochondriale Elektronentransportkette.svg 512 × 464; 152 KB
-
 Mitokonder.gif 772 × 501; 6 KB
-

-
 Modeling of the Resting Potential.tif 1,280 × 694; 437 KB
-
 MOS MOA.jpg 640 × 448; 42 KB
-
 Mécanisme d'action des sidérophores.png 659 × 420; 48 KB
-
 Neuraminidasemechanism with without.jpg 654 × 438; 168 KB
-
 NicotineChromaffinCells WP1603.png 780 × 501; 32 KB
-
 NicotineDopaminergic WP1602.png 914 × 873; 70 KB
-
 Nitrogenase reaction.PNG 1,030 × 614; 78 KB
-
 NKpump.jpg 637 × 520; 221 KB
-
 Non-competitive inhibition.svg 879 × 983; 31 KB
-
 Noncompetetiveinhibition.png 597 × 455; 11 KB
-
 Noncompetitive diagram.png 1,114 × 1,016; 888 KB
-
 Noncompetitive inhibition.png 299 × 201; 2 KB
-
 Noncompetitive kinetics.PNG 643 × 454; 14 KB


.png)


.svg)
.svg)


.png)


.png)


_A.jpg)
_B.jpg)


.png)


.svg)
.svg)