Category:Carbon dioxide emission maps of the world
Media in category "Carbon dioxide emission maps of the world"
The following 114 files are in this category, out of 114 total.
-
 2018 EPI Ecosystem Vitality Objective - Climate and Energy (48008654153).jpg 3,070 × 2,403; 816 KB
-
 Absolute-change-co2 (OWID 0005).png 850 × 600; 102 KB
-
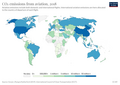
 Annual CO2 emissions from deforestation, global.png 1,746 × 1,234; 360 KB
-
 Annual CO₂ emissions, OWID.svg 850 × 600; 141 KB
-
 Annual share of global CO₂ emissions, OWID.svg 850 × 600; 141 KB
-
 Annual-co-emissions-from-other-industry (OWID 0053).png 850 × 600; 87 KB
-
 Annual-co2-coal (OWID 0051).png 850 × 600; 97 KB
-
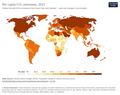
 Annual-co2-emissions-per-country-map.png 3,400 × 2,400; 793 KB
-
 Annual-co2-flaring (OWID 0050).png 850 × 600; 93 KB
-
 Annual-co2-gas (OWID 0049).png 850 × 600; 95 KB
-
 Annual-co2-including-land-use (OWID 0044).png 850 × 600; 112 KB
-
 Annual-co2-oil (OWID 0046).png 850 × 600; 94 KB
-
-

-
 Carbon Dioxide per GDP (5457257860).jpg 3,168 × 2,354; 680 KB
-
 Change-co2-annual-pct (OWID 0165).png 850 × 600; 101 KB
-
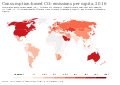
 Co-emissions-per-capita-map.png 3,400 × 2,700; 913 KB
-
 CO2 emissions per capita, 2016 (Our World in Data).svg 850 × 600; 155 KB
-
 CO2 emissions per capita, 2017 (Our World in Data).svg 850 × 600; 155 KB
-
 CO2 per capita per country.png 800 × 370; 72 KB
-
 CO2 responsibility 1950-2000.svg 940 × 477; 1.98 MB
-
 Co2-emissions-aviation (OWID 0198).png 850 × 600; 103 KB
-
 Co2-emissions-domestic-aviation (OWID 0199).png 850 × 600; 102 KB
-
 CO2-emissions-per-capita-map.png 3,400 × 2,706; 1,002 KB
-
 Co2-intensity.png 3,400 × 2,400; 862 KB
-
 Co2-international-aviation (OWID 0191).png 850 × 600; 101 KB
-
 Co2-land-use (OWID 0189).png 850 × 600; 108 KB
-
 Co2-land-use-global-share (OWID 0190).png 850 × 600; 106 KB
-
 Co2-land-use-per-capita (OWID 0187).png 850 × 600; 104 KB
-
 Consumption-based CO₂ emissions per capita, OWID.svg 850 × 600; 140 KB
-
 Consumption-based CO₂ emissions, OWID.svg 850 × 600; 141 KB
-
 Consumption-co2-emissions (OWID 0252).png 850 × 600; 110 KB
-
 Consumption-co2-per-capita (OWID 0247).png 850 × 600; 108 KB
-
 Consumption-co2-per-capita-equity (OWID 0250).png 850 × 600; 111 KB
-
 Countries by carbon dioxide emissions world map deobfuscated.png 1,577 × 620; 56 KB
-
 Countries by carbon dioxide emissions world map.PNG 1,577 × 620; 39 KB
-
 CO₂ emissions embedded in global trade, OWID.svg 850 × 600; 141 KB
-
 CO₂ emissions embedded in trade, OWID.svg 850 × 600; 141 KB
-
 CO₂ emissions per capita, OWID.svg 850 × 600; 140 KB
-
 Cumulative CO₂ emissions, OWID.svg 850 × 600; 141 KB
-
 Cumulative-co-emissions-from-other-industry (OWID 0225).png 850 × 600; 88 KB
-
 Cumulative-co-emissions.svg 850 × 600; 168 KB
-
 Cumulative-co2-cement (OWID 0223).png 850 × 600; 94 KB
-
 Cumulative-co2-coal (OWID 0222).png 850 × 600; 101 KB
-
 Cumulative-co2-flaring (OWID 0220).png 850 × 600; 96 KB
-
 Cumulative-co2-gas (OWID 0218).png 850 × 600; 98 KB
-
 Cumulative-co2-including-land (OWID 0219).png 850 × 600; 116 KB
-
 Cumulative-co2-land-use (OWID 0216).png 850 × 600; 109 KB
-
 Cumulative-co2-oil (OWID 0215).png 850 × 600; 96 KB
-
 Distribution of committed CO2 emissions from developed fossil fuel reserves.jpg 1,725 × 2,176; 1.03 MB
-
 Emission de CO2 dans le monde en 2011.png 1,005 × 602; 147 KB
-
 Emissions cumulatives CO2 2019.jpg 2,656 × 1,875; 1.18 MB
-
 Imported or exported CO₂ emissions per capita, OWID.svg 850 × 600; 141 KB
-
 Imported-or-exported-co-emissions-per-capita (OWID 0496).png 850 × 600; 112 KB
-
 Land-use-co2-quality-flag (OWID 0590).png 850 × 600; 104 KB
-
 Meat and Dairy CO2 Emissions - 20 largest emitters.png 2,066 × 1,351; 398 KB
-

-
-

-

-
-

-
-
-

-
-
-
-

-
-

-

-
-
-
-
-
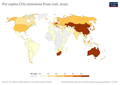 Per capita CO2 emissions from coal.png 3,400 × 2,400; 661 KB
-
 Per-capita-co2-aviation (OWID 0794).png 850 × 600; 93 KB
-
 Per-capita-co2-aviation-adjusted.svg 850 × 600; 168 KB
-
 Per-capita-co2-cement (OWID 0795).png 850 × 600; 90 KB
-
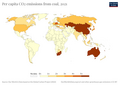 Per-capita-co2-coal (OWID 0793).png 850 × 600; 91 KB
-
 Per-capita-co2-domestic-aviation (OWID 0790).png 850 × 600; 111 KB
-
 Per-capita-co2-flaring (OWID 0789).png 850 × 600; 92 KB
-
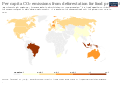 Per-capita-co2-food-deforestation (1).svg 850 × 600; 167 KB
-
 Per-capita-co2-gas (OWID 0788).png 850 × 600; 91 KB
-
 Per-capita-co2-including-land (OWID 0785).png 850 × 600; 109 KB
-
 Per-capita-co2-international-aviation (OWID 0784).png 850 × 600; 104 KB
-
 Per-capita-co2-international-flights-adjusted (OWID 0783).png 850 × 600; 118 KB
-
 Per-capita-co2-oil (OWID 0781).png 850 × 600; 91 KB
-
 Per-capita-co2-transport (OWID 0779).png 850 × 600; 98 KB
-
 Per-capita-co2-vs-average (OWID 0778).png 850 × 600; 106 KB
-
 Ratio of GDP to carbon dioxide emissions.PNG 1,347 × 628; 31 KB
-
 Share of global cumulative CO₂ emissions, OWID.svg 850 × 600; 140 KB
-
 Share-co2-embedded-in-trade (OWID 0941).png 850 × 600; 110 KB
-
 Share-co2-emissions-aviation (OWID 0940).png 850 × 600; 105 KB
-
 Share-co2-international-aviation (OWID 0938).png 850 × 600; 102 KB
-
 Share-global-co2-cement (OWID 1029).png 850 × 600; 94 KB
-
 Share-global-co2-coal (OWID 1028).png 850 × 600; 95 KB
-
 Share-global-co2-domestic-aviation (OWID 1027).png 850 × 600; 99 KB
-
 Share-global-co2-flaring (OWID 1025).png 850 × 600; 95 KB
-
 Share-global-co2-gas (OWID 1026).png 850 × 600; 92 KB
-
 Share-global-co2-including-land (OWID 1023).png 850 × 600; 110 KB
-
 Share-global-co2-oil (OWID 1024).png 850 × 600; 97 KB
-
 Share-global-cumulative-co2-cement (OWID 1021).png 850 × 600; 93 KB
-
 Share-global-cumulative-co2-coal (OWID 1022).png 850 × 600; 95 KB
-
 Share-global-cumulative-co2-flaring (OWID 1020).png 850 × 600; 95 KB
-
 Share-global-cumulative-co2-gas (OWID 1019).png 850 × 600; 95 KB
-
 Share-global-cumulative-co2-including-land (OWID 1017).png 850 × 600; 112 KB
-

-

-

-
 World CO2 Emissions 1900-2004.jpg 1,023 × 723; 210 KB
-
-
 Yıllık CO₂ emisyonları, OWID.svg 850 × 600; 150 KB
.jpg)
.png)


.png)
.png)

.png)
.png)
.png)
.png)


.jpg)
.png)

.svg)
.svg)


.png)
.png)


.png)
.png)
.png)
.png)


.png)
.png)
.png)


.png)

.png)
.png)
.png)
.png)
.png)
.png)
.png)


.png)
.png)

_budgets_inferred_from_atmospheric_observations_(SVS5081_-_Fossil_Fuels_2015_2020_Dark).png)
_budgets_inferred_from_atmospheric_observations_(SVS5081_-_FossilFuels_2015_2020_Light).png)
_budgets_inferred_from_atmospheric_observations_(SVS5081_-_FossilFuels_2015_2020_White_4Kx3K).png)
_budgets_inferred_from_atmospheric_observations_(SVS5081_-_NationalCO2Budgets_2015_2020_Dark).png)
_budgets_inferred_from_atmospheric_observations_(SVS5081_-_NationalCO2Budgets2015_2020_Light).png)
_budgets_inferred_from_atmospheric_observations_(SVS5081_-_NetEmissions_2015_2020_Dark).png)
_budgets_inferred_from_atmospheric_observations_(SVS5081_-_NetEmissions_2015_2020_Light_3840x2160_Spanish).png)
_budgets_inferred_from_atmospheric_observations_(SVS5081_-_NetEmissions_2015_2020_Light).png)
_budgets_inferred_from_atmospheric_observations_(SVS5081_-_NetEmissions_2015_2020_White_4Kx3K).png)
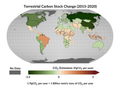
_budgets_inferred_from_atmospheric_observations_(SVS5081_-_TerrestrialCarbon_2015_2020_Dark).png)
_budgets_inferred_from_atmospheric_observations_(SVS5081_-_TerrestrialCarbon_2015_2020_Light).png)
_budgets_inferred_from_atmospheric_observations_(SVS5081_-_TerrestrialCarbon_2015_2020_White_4Kx3K).png)

.png)

.png)
.png)
.png)
.png)
.svg)
.png)
.png)
.png)
.png)
.png)
.png)


.png)
.png)
.png)
.png)
.png)
.png)
.png)
.png)
.png)
.png)
.png)
.png)
.png)
.png)
.png)
.png)
.png)
.png)


.png)