Category:Comparisons of transportation products by outcomes
Media in category "Comparisons of transportation products by outcomes"
The following 11 files are in this category, out of 11 total.
-
 Allocation of Space for Transport Infrastructure - Example of Berlin.png 4,267 × 4,268; 343 KB
-
 Carbon Emissions Per Passenger.png 3,718 × 4,159; 414 KB
-
 Carbon-footprint-travel-mode.png 3,400 × 2,956; 764 KB
-
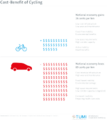 Cost-Benefit of Cycling.png 3,718 × 4,158; 290 KB
-
 Passenger Capacity of different Transport Modes.png 3,722 × 4,159; 457 KB
-
 Road Space Requirements.png 3,717 × 4,182; 308 KB
-
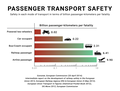 Road-way vs. railway safety.png 3,337 × 2,538; 348 KB
-
 Transport Energy Consumption in Europe.png 4,017 × 4,158; 236 KB
-
 Transport Energy Consumption.png 3,906 × 4,159; 259 KB
-
 Transports600 (English).svg 793 × 1,811; 1.07 MB
-
 Well to Wheel Efficiency.png 5,790 × 4,159; 375 KB


.svg)