Category:Control charts created with R
Media in category "Control charts created with R"
The following 10 files are in this category, out of 10 total.
-
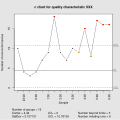 C control chart.svg 630 × 629; 39 KB
-
 Individuals chart for a paired individuals and MR chart.svg 630 × 629; 42 KB
-
 MR chart for a paired individuals and MR chart.svg 630 × 629; 38 KB
-
 Np control chart.svg 630 × 629; 38 KB
-
 P control chart.svg 630 × 629; 38 KB
-
 R chart for a paired xbar and R chart.svg 630 × 629; 34 KB
-
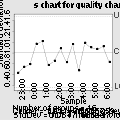 S chart for a paired xbar and s chart.svg 630 × 629; 35 KB
-
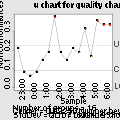 U control chart.svg 630 × 629; 39 KB
-
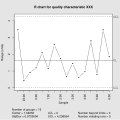
 Xbar chart for a paired xbar and R chart.svg 630 × 629; 37 KB
-
 Xbar chart for a paired xbar and s chart.svg 630 × 629; 43 KB


