Category:Demographic charts of Germany
Subcategories
This category has the following 8 subcategories, out of 8 total.
Media in category "Demographic charts of Germany"
The following 9 files are in this category, out of 9 total.
-
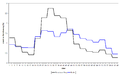 Altersstruktur prenzlberg.png 1,065 × 663; 12 KB
-
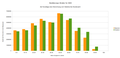
 Bevölkerung nach Geschlecht und Altersgruppen Schwerte 2020.png 952 × 673; 21 KB
-
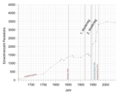 Bevölkerungsentwicklung Peckeloh 2017.png 6,308 × 4,938; 1.35 MB
-
 BevölkerungsStruktur2020.png 1,283 × 617; 34 KB
-
 Peckeloh Einwohnerentwicklung Stand 2017.svg 1,514 × 1,185; 9 KB
-
 Population evolution Germany.svg 550 × 450; 21 KB
-
 PSM V70 D575 Population increase of the usa compared to major european states.png 1,660 × 2,327; 186 KB
-
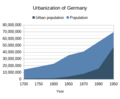 Urbanization of Germany.png 413 × 340; 15 KB
-
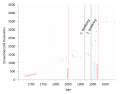
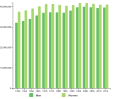
 Население Германии 1871-2015.png 1,792 × 745; 59 KB


