Category:Diagrams about the COVID-19 pandemic in Europe
Subcategories
This category has the following 51 subcategories, out of 51 total.
A
B
C
D
F
G
I
L
M
N
P
R
S
U
Media in category "Diagrams about the COVID-19 pandemic in Europe"
The following 98 files are in this category, out of 98 total.
-
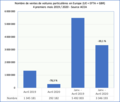 Car Sales Europe April 2020.png 708 × 603; 36 KB
-
 Cas Covid-19 huit pays Europe juin juillet 2020.png 432 × 621; 47 KB
-
 Cas mensuels Covid-19 Europe par groupe de pays 2020-2022.png 4,070 × 2,983; 528 KB
-
 Cas mensuels Covid-19 Europe par groupe de pays.png 4,963 × 2,983; 614 KB
-
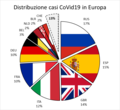 CasesCoVid19EuropeByCountries.png 692 × 637; 67 KB
-
 Coronavirus-deaths-SE EU Scandinavia.svg 850 × 600; 202 KB
-
 CoVID 19 Worldwide Growth Rates Graph 6 (updated 2020-03-18).png 982 × 755; 160 KB
-
 Covid-19 cases per 100,000 population, US and EU.jpg 560 × 387; 53 KB
-
 Covid-19 deaths per 100,000 population, US and EU.jpg 563 × 370; 53 KB
-
 Covid-19 Europe Nov 03, 2021.jpg 947 × 552; 117 KB
-
 Covid-19 variants 07 02 2022.png 2,323 × 1,663; 220 KB
-
 Covid-19 variants Europe 10 01 2022.png 2,323 × 1,498; 184 KB
-
 COVID-19-EU-cases-log.svg 810 × 513; 194 KB
-
 COVID-19-EU-cases-relative-log.svg 810 × 513; 206 KB
-
 COVID-19-EU-cases-relative.svg 810 × 513; 174 KB
-
 COVID-19-EU-cases.svg 810 × 513; 123 KB
-
 COVID-19-EU-log-relative-deaths.svg 810 × 513; 188 KB
-
 COVID-19-Europe-nonEU-relative-deaths-log.svg 810 × 513; 145 KB
-
 COVID-19-Europe-selection-cases-relative-increment-log.svg 810 × 513; 396 KB
-
 COVID-19-Europe-selection-cases-relative-increment.svg 810 × 513; 266 KB
-
 COVID-19-Europe-selection-deaths-relative-increment-log.svg 810 × 513; 386 KB
-
 COVID-19-Europe-selection-deaths-relative-increment.svg 810 × 513; 397 KB
-
 COVID-19-Europe-selection-relative-deaths-log.svg 810 × 513; 171 KB
-
 Covid-vaccinations-deaths-EU-Sweden.svg 850 × 600; 140 KB
-
 Covid19-some-EU-countries-March-20.png 1,132 × 1,092; 224 KB
-
 Décès Covid cumulés en Europe, Amérique et Asie 30 novembre 2020.png 1,656 × 1,054; 108 KB
-
 Décès Covid cumulés en Europe, Amérique et Asie 31 décembre 2020.png 1,654 × 1,204; 127 KB
-
 Décès Covid cumulés en Europe, Amérique et Asie 31 janvier 2021.png 1,458 × 1,132; 156 KB
-
 Décès Covid en Europe, Amérique et Asie 15 novembre 2020.png 1,497 × 1,014; 152 KB
-
 Décès Covid en Europe, Amérique et Asie 30 novembre 2020.png 1,654 × 1,056; 137 KB
-
 Décès Covid en Europe, Amérique et Asie 31 décembre 2020.png 1,654 × 1,204; 160 KB
-
 Décès Covid en Europe, Amérique et Asie 31 janvier 2021.png 1,454 × 1,132; 193 KB
-
 Décès Covid en Europe, Amérique et Asie octobre 2020.png 717 × 485; 57 KB
-
 Décès Covid-19 par Région 30 septembre 2020.png 777 × 517; 42 KB
-
 Décès Covid-19 par Région 31 août 2020.png 772 × 512; 45 KB
-
 Décès cumulés Covid Europe Amérique Asie 2020-2022.png 3,941 × 2,901; 593 KB
-
 Décès cumulés Covid Europe Amérique Asie 30 juin 2021.png 3,643 × 2,818; 414 KB
-
 Décès cumulés Covid Europe Amérique Asie 30 novembre 2021.png 3,643 × 2,818; 401 KB
-
 Décès cumulés Covid Europe Amérique Asie 30 septembre 2021.png 3,643 × 2,818; 441 KB
-
 Décès cumulés Covid Europe Amérique Asie 31 aout 2021.png 3,643 × 2,818; 435 KB
-
 Décès cumulés Covid Europe Amérique Asie 31 décembre 2021.png 3,643 × 2,818; 407 KB
-
 Décès cumulés Covid Europe Amérique Asie 31 juillet 2021.png 3,643 × 2,818; 421 KB
-
 Décès cumulés Covid Europe Amérique Asie 31 octobre 2021.png 3,643 × 2,818; 444 KB
-
 Décès cumulés en Europe, Amérique Asie 31 mars 2021.png 1,444 × 1,122; 163 KB
-
 Décès cumulés en Europe, Amérique et Asie au 28 février 2021.png 721 × 563; 49 KB
-
 Décès cumulés Europe Amérique Asie 30 avril 2021.png 723 × 559; 52 KB
-
 Décès cumulés Europe Amérique Asie 31 mai 2021.png 3,643 × 2,818; 450 KB
-
 Décès Europe Covid-19 mars avril 2020.png 910 × 785; 86 KB
-
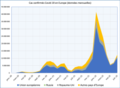
 Décès mensuels Covid-19 Europe par groupe de pays 2020-2022.png 4,070 × 2,488; 533 KB
-
 Décès mensuels Covid-19 Europe par groupe de pays au 31 janvier 2022.png 1,081 × 579; 79 KB
-
 Décès mensuels Covid-19 Europe par groupe de pays.png 4,817 × 2,653; 861 KB
-
 Décès mensuels Covid-19 Europe.png 2,323 × 2,328; 428 KB
-
 Décès Monde Europe COVID-19 Mars Juin 2020.png 1,029 × 773; 111 KB
-
 Décès Monde Europe COVID-19 Mars Mai 2020.png 910 × 785; 91 KB
-
 Décès quotidiens Covid en Europe Amérique Asie 30 avril 2021.png 724 × 561; 70 KB
-
 Décès quotidiens Covid en Europe Amérique Asie 31 mai 2021.png 3,643 × 2,818; 566 KB
-
 Décès quotidiens Covid en Europe Amérique Asie 31 mars 2021.png 1,442 × 1,122; 198 KB
-

-
 Décès quotidiens Covid Europe Amérique Asie 2020-2022.png 3,941 × 2,905; 652 KB
-
 Décès quotidiens Covid Europe Amérique Asie 30 juin 2021.png 3,643 × 2,818; 585 KB
-
 Décès quotidiens Covid Europe Amérique Asie 30 novembre 2021.png 3,643 × 2,818; 564 KB
-
 Décès quotidiens Covid Europe Amérique Asie 30 septembre 2021.png 3,643 × 2,818; 615 KB
-
 Décès quotidiens Covid Europe Amérique Asie 31 aout 2021.png 3,643 × 2,818; 603 KB
-
 Décès quotidiens Covid Europe Amérique Asie 31 décembre 2021.png 3,643 × 2,818; 583 KB
-
 Décès quotidiens Covid Europe Amérique Asie 31 juillet 2021.png 3,643 × 2,818; 593 KB
-
 Décès quotidiens Covid Europe Amérique Asie 31 octobre 2021.png 3,643 × 2,818; 617 KB
-
 E01.1.png 906 × 537; 13 KB
-
 E01noewayCovid19.png 906 × 537; 13 KB
-
 EvolutionCoVid19Europe-New.png 816 × 605; 152 KB
-
 EvolutionCoVid19Europe-Positive.png 826 × 651; 57 KB
-
 EvolutionCoVid19Europe-Start.png 825 × 652; 49 KB
-
 Indice mesures Covid-19 restriction sanitaire Europe France.png 2,612 × 1,833; 414 KB
-
 Nombre doses vaccin cumulé 2022.png 3,652 × 2,653; 681 KB
-
 Novel COVID-19 cases in EU and UK.png 1,160 × 447; 146 KB
-
 Passagers aériens Europe 2019-2020.png 454 × 291; 28 KB
-
 Passagers aériens Europe janvier - juin 2020.png 362 × 235; 21 KB
-
 Passenger Car Sales Europe June 2020.png 688 × 603; 34 KB
-
 Passenger Car Sales Europe May 2020.png 708 × 603; 41 KB
-
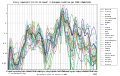
 Počet nakažených nemocí COVID-19 na 1 mil. obyvatel.png 1,134 × 851; 70 KB
-
 Počet nakažených nemocí COVID-19 na 1 mil. obyvatel.svg 1,052 × 744; 475 KB
-
 SARS-CoV-2 infections in and around Poland en.svg 512 × 384; 39 KB
-
 SARS-CoV-2 infections in and around Poland pl.svg 512 × 384; 51 KB
-
 SARS-CoV-2-PL pl.svg 720 × 720; 69 KB
-
 SARS-CoV-2-PL.svg 720 × 720; 69 KB
-
 Trakectproes-Covid-confirmed-cases-since-100th-case in Europe.svg 850 × 600; 459 KB
-
 Variation PIB - GDP Union européenne.png 575 × 344; 27 KB
-
 WHO Covid C Gibraltar.pdf 3,300 × 1,950; 17 KB
-
 WHO Covid C Guernsey.pdf 3,300 × 1,950; 17 KB
-
 WHO Covid C Isle of Man.pdf 3,300 × 1,950; 17 KB
-
 WHO Covid C Jersey.pdf 3,300 × 1,950; 17 KB
-
 WHO Covid rn confirmed,deaths European Region01.pdf 3,300 × 1,950; 31 KB
-
 WHO Covid rn confirmed,deaths European Region02.pdf 3,300 × 1,950; 31 KB
-
 WHO Covid rn confirmed,deaths European Region03.pdf 3,300 × 1,950; 28 KB
-
 WHO Covid rn confirmed,deaths European Region04.pdf 3,300 × 1,950; 30 KB
-
 WHO Covid rn confirmed,deaths European Region05.pdf 3,300 × 1,950; 31 KB
-
 WHO Covid rn confirmed,deaths European Region06.pdf 3,300 × 1,950; 31 KB
-
 WHO Covid rn confirmed,deaths European Region07.pdf 3,300 × 1,950; 32 KB
-
 WHO Covid rn confirmed,deaths European Region08.pdf 3,300 × 1,950; 22 KB


.png)


