Category:Diagrams by Jane S. Richardson
Diagrams by Jane S. Richardson
Media in category "Diagrams by Jane S. Richardson"
The following 168 files are in this category, out of 168 total.
-
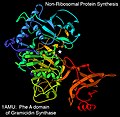 1amu gramicidin synthase PheA rib.jpg 820 × 800; 294 KB
-
 1axc PCNA ProCheck Rama.jpg 500 × 500; 158 KB
-
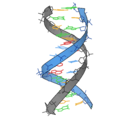 1bna naba ribbon v.png 3,228 × 3,180; 513 KB
-
 1cag collagen triple helix.tiff 1,200 × 740; 109 KB
-
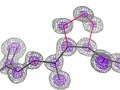
 1gwe antipar betaSheet both.png 2,000 × 1,100; 1.04 MB
-
 1n0j H mit MnSOD D1 rib.png 807 × 757; 52 KB
-
 1n0j H mit MnSOD D2 rib.png 806 × 757; 53 KB
-
 1n11 ankyrin repeats curl.tiff 1,200 × 800; 189 KB
-
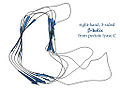
 1QRE L3betaHelix.jpg 949 × 768; 169 KB
-
 1qys TOP7 design rib.png 1,200 × 1,000; 456 KB
-
 1rns supr on 7rsa.jpg 1,333 × 1,234; 443 KB
-
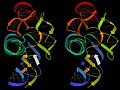
 1sdy CuZnSOD dimer ribbon.png 800 × 770; 58 KB
-
 1xk8 trimer ribbon.png 1,170 × 1,024; 253 KB
-
 27 Lys rotamers.png 2,556 × 2,276; 254 KB
-
 2brd bacteriorhodopsin biolU rib top.tiff 1,200 × 1,200; 415 KB
-
 2c9v CuZn rib n site.png 700 × 651; 69 KB
-
 2k5d NMR ensemble ribbons.jpg 973 × 725; 394 KB
-
 2nn6 exosome rib.png 2,700 × 2,700; 1.86 MB
-
 2nr2 ubq 144models.png 2,700 × 2,700; 840 KB
-
 2RH1 trim rib lig.png 4,000 × 3,650; 1 MB
-
 2SOD ribbon colorPencil WhBkgd.png 3,000 × 3,200; 4.58 MB
-
 2SOD ribbon pastel.jpg 1,200 × 1,200; 1.41 MB
-
 2zta GCN4 Leu zip core.tif 1,200 × 900; 306 KB
-
 3hla ribbon.png 1,000 × 1,300; 98 KB
-
 3kin kinesin ribbon.png 2,700 × 2,700; 704 KB
-
 3sn6 G-coupled ribbon.png 3,090 × 3,820; 1.49 MB
-
 3u5z clamp closed.png 600 × 600; 346 KB
-
 3u5z clamp open.png 600 × 600; 351 KB
-
 4fby spline het.png 2,640 × 1,840; 1.38 MB
-
 4fc1 Arg17 neutron H vs D in map.png 2,388 × 1,793; 1.43 MB
-
 4sbv ribbon 3mer.png 2,700 × 2,700; 922 KB
-
 50S Hmar 3CC2 ribosome outline.jpg 10,000 × 9,400; 933 KB
-
 50S Hmar 3CC2 ribosome outline.png 2,500 × 2,350; 118 KB
-
 5fold 2dom 3CDX ribbon.png 900 × 900; 372 KB
-
 6 Ramachandran plots of wwPDB validation.png 13,400 × 9,040; 10.04 MB
-
 70S Ecoli Ribosome outline.jpg 10,000 × 12,000; 1.15 MB
-
 70S Ecoli Ribosome outline.png 2,500 × 3,000; 162 KB
-
 All-atom contacts for two GC basepairs of RNA.jpg 1,031 × 689; 241 KB
-
 All-atomContacts 1gciAlas.jpg 518 × 720; 131 KB
-
 Alpha vs 310 helix end views.jpg 1,340 × 720; 178 KB
-
 AlphaHemolysin membrane heptamer 7AHL sideVw.jpg 800 × 768; 482 KB
-
 AlphaHemolysin membrane heptamer 7AHL VwDownPore.jpg 1,600 × 1,602; 1.06 MB
-
 Bbellin design blueRibbon.png 2,454 × 3,297; 1.83 MB
-
 BPTI rib shaded SSylw.jpg 5,900 × 4,000; 4.68 MB
-
 BPTI ribbon 1bpi.jpg 500 × 720; 131 KB
-
 BPTI ribbon bw.jpg 1,883 × 1,366; 441 KB
-
 BPTI ribbon.jpg 512 × 768; 145 KB
-
 BPTI seq ribbon sticks.jpg 1,024 × 768; 246 KB
-
 BPTI swish ribbon.jpg 516 × 765; 153 KB
-
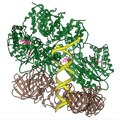
 CAP-DNA 1cgp rib.tiff 1,200 × 1,160; 343 KB
-
 CAPdimer.jpg 730 × 768; 552 KB
-
 CAPgreekKeyPair.jpg 1,024 × 768; 112 KB
-
 Carboxypeptidase-A rib bw.tif 1,200 × 940; 299 KB
-
 CASP PredCtr cumCalpha plot T0398.jpg 1,000 × 700; 600 KB
-
 Clamp loader open 3u5z.tiff 1,000 × 1,000; 629 KB
-
 Classic beta-bulge schematic.png 660 × 860; 163 KB
-
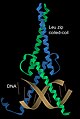 Coiled-coil TF Max on DNA.jpg 900 × 1,340; 252 KB
-
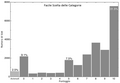
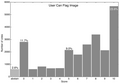
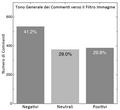 Comment tone vertBarChart it.png 653 × 600; 32 KB
-
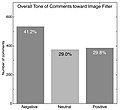 Comment tone vertBarChart.jpg 653 × 600; 72 KB
-
 Comment tone vertBarChart.png 653 × 600; 54 KB
-
 Crambin P41 hi-res map 3nir.tiff 1,024 × 768; 695 KB
-
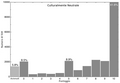 Culturally-neutral votes vertBarChart it.png 967 × 670; 45 KB
-
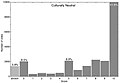 Culturally-neutral votes vertBarChart.jpg 967 × 670; 87 KB
-
 Culturally-neutral votes vertBarChart.png 967 × 670; 62 KB
-
 CuZn SOD precession photo C2.jpg 550 × 550; 215 KB
-
 CuZnSOD 2dimers.jpg 700 × 768; 221 KB
-
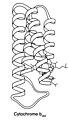 Cytochrome b562 ribbon BW.jpg 1,610 × 2,800; 747 KB
-
 Cytochrome C 1cyt Fe rib.tif 1,200 × 800; 333 KB
-
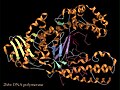 DNApolymerase-DNA complex 2HHV ribbon.jpg 1,024 × 768; 362 KB
-
 Early computer ribbon TrpRepressor intertwinedDimer 1WRP.jpg 1,024 × 768; 342 KB
-
 Easy-choice votes vertBarChart it.png 967 × 670; 43 KB
-
 Easy-choice votes vertBarChart.jpg 967 × 670; 90 KB
-
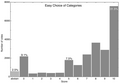 Easy-choice votes vertBarChart.png 967 × 670; 63 KB
-
 Ecoli 70S ribosome pair with tRNA mRNA.png 2,700 × 2,200; 2.14 MB
-
 Elastase ribbon BW.jpg 4,000 × 3,458; 2.66 MB
-
 Emigrant Wilderness outline map.png 1,910 × 2,270; 455 KB
-
 F22 calmodulin 3cln-2bbm both.tiff 1,200 × 1,100; 120 KB
-
 F42 K+channel select stereo.jpg 2,000 × 1,019; 597 KB
-
 F44 HolJnct 2crx.jpg 2,700 × 2,700; 1.45 MB
-
 Felix design model redRibbon.png 3,200 × 3,720; 6.21 MB
-
 Flavodoxin worm drawing.jpg 2,391 × 2,344; 544 KB
-
 G riboswitch RNA ribbon.jpg 760 × 760; 163 KB
-
 G riboswitch site w map contacts suite-labels.jpg 1,024 × 768; 540 KB
-
 General-case Ramachandran data and contours T8000.png 2,320 × 2,470; 1.42 MB
-
 GFP 1ema ribbon fluor.png 2,000 × 2,600; 534 KB
-
 Glycine Ramachandran data and contours T8000.png 2,320 × 2,470; 1.21 MB
-
 GNRA tetraloop motifs.jpg 1,024 × 768; 262 KB
-
 Group-I intron secstr 1grz.tiff 1,200 × 1,060; 181 KB
-
 Half-vault 39-fold.png 4,520 × 3,608; 3.9 MB
-
 Half-vault front.png 4,520 × 3,608; 3.73 MB
-
 Hand-drawn helix ribbons at various angles.jpg 1,024 × 768; 230 KB
-
 Helical Wheel 2NRL 77-92 KaelFischer.jpg 500 × 500; 111 KB
-
 Hemoglobin beta red whBkg.tif 600 × 600; 341 KB
-
 Hemoglobin betaSubunit ribbon.jpg 600 × 768; 270 KB
-
 HEW lysozyme rib bw.tif 1,200 × 840; 240 KB
-
 Immunoglobulin VL dom ribbon bw.jpg 1,670 × 2,340; 699 KB
-
 Importance votes vertBarChart it.png 967 × 670; 47 KB
-
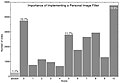 Importance votes vertBarChart.jpg 967 × 670; 101 KB
-
 Importance votes vertBarChart.png 967 × 670; 71 KB
-
 Incredulase framed.jpg 672 × 840; 561 KB
-
 Insulin worm bw.jpg 1,200 × 833; 114 KB
-
 KiNG backrubFit modeling in density.jpg 3,200 × 2,332; 2.47 MB
-
 KiNGinMolProbity validation3Dgraphics.jpg 2,062 × 1,636; 761 KB
-
 LDH dom1 ribbon edge view bw.jpg 2,160 × 2,800; 901 KB
-
 LDH dom1 ribbon side view.jpg 3,000 × 3,906; 1.32 MB
-
 Logged-out votes vertBarChart it.png 967 × 670; 44 KB
-
 Logged-out votes vertBarChart.jpg 967 × 670; 89 KB
-
 Logged-out votes vertBarChart.png 967 × 670; 62 KB
-
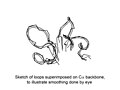 Loop smoothing for ribbons.jpg 1,024 × 768; 152 KB
-
 MolProbity clashscore vs year.png 986 × 756; 118 KB
-
 Myoglobin helix cylinder sketch.jpg 1,200 × 1,200; 341 KB
-
 Myohemerythrin rib BW.jpg 1,880 × 2,800; 742 KB
-
 Nucleosome 1aoi rib.tiff 1,200 × 1,060; 400 KB
-
 Offset lines illusion for beta ribbons.jpg 1,024 × 768; 191 KB
-
 Pectate lyase R3betaHelix.jpg 1,024 × 768; 211 KB
-
 PHBH domains.jpg 1,024 × 768; 733 KB
-
 PhiPsi drawing with plane and labels.jpg 720 × 768; 135 KB
-
 Phosphorylase domain2.jpg 1,024 × 768; 307 KB
-
 Potato CPA inhibitor ribbon.jpg 1,200 × 900; 405 KB
-
 Protein backbone PhiPsiOmega drawing.jpg 548 × 1,000; 55 KB
-
 Protein backbone PhiPsiOmega drawing.svg 520 × 988; 77 KB
-
 Protein Hydrogens in electron Density 1yk4 Y13.jpg 1,024 × 768; 287 KB
-
 Rama redux Gly 3600x3600 graOrng.jpg 3,600 × 3,600; 4.18 MB
-
 Ramachandran plot general 100K.jpg 750 × 670; 225 KB
-
 Ramachandran plot Gly.jpg 750 × 670; 258 KB
-
 Ramachandran plot original outlines.jpg 500 × 500; 67 KB
-
 Ramachandran plot Pro.jpg 750 × 670; 120 KB
-
 RDC curves on NMRmodels 1d3z D58NH.jpg 1,024 × 768; 141 KB
-
 Reversible-hiding votes vertBarChart it.png 967 × 670; 58 KB
-
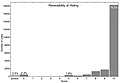 Reversible-hiding votes vertBarChart.jpg 967 × 670; 91 KB
-
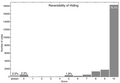 Reversible-hiding votes vertBarChart.png 967 × 670; 74 KB
-
 Ribbon-drawing technique two examples.jpg 800 × 1,430; 307 KB
-
 RibonucleaseA ribbon 7rsa.jpg 880 × 800; 193 KB
-
 RibonucleaseA SS line.png 920 × 780; 159 KB
-
 RibonucleaseA SS paleRib.png 920 × 780; 158 KB
-
 Ribosome Ecoli70S QuteMol.tiff 1,200 × 1,200; 1.47 MB
-
 RNA backbone rebuild 3cc2 5S 77.png 900 × 500; 115 KB
-
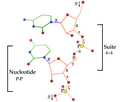 RNA residue-Suite diagram.tif 920 × 780; 793 KB
-
 RNA residueSuite diagram.tif 920 × 780; 704 KB
-
 Rubredoxin Fe 2rxn rib.tif 900 × 800; 214 KB
-
 Smotif in RNA suite-labeled.jpg 1,024 × 768; 245 KB
-
 Staph nuclease brass Arg-Phe on glass map stack.png 556 × 740; 776 KB
-
 Staph nuclease brass model to UV worm.png 1,050 × 1,152; 1.44 MB
-
 Staph nuclease JSR BW shaded-ribbon.jpg 1,024 × 768; 157 KB
-
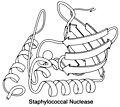 Staph nuclease ribbon bw.jpg 2,200 × 1,970; 739 KB
-
 Structure validation concept.jpg 2,200 × 2,200; 1.28 MB
-
 Subtilisin rib bw.tif 1,200 × 900; 330 KB
-
 Superoxide dismutase Cu Zn site.jpg 1,024 × 768; 154 KB
-
 Swall Meadows from Open Street Map.png 1,345 × 1,116; 424 KB
-
 Target3dsmRib 354predictedModels CASP8.jpg 1,200 × 1,006; 647 KB
-
 TIM ribbon pastel wide mat.jpg 3,090 × 2,490; 3.49 MB
-
 Trans Proline Ramachandran data and contours T8000.png 2,320 × 2,470; 402 KB
-
 Transcription factor Zif268 binding DNA.jpg 900 × 750; 218 KB
-
 Triosephosphate Isomerase Ribbon pastel.png 2,650 × 2,010; 5.69 MB
-
 TriosePhosphateIsomerase endVw ribbon BWline.jpg 660 × 768; 169 KB
-
 TriosePhosphateIsomerase Ribbon pastel photo mat edit.jpg 2,547 × 1,952; 2.46 MB
-
 TriosePhosphateIsomerase Ribbon pastel trans.png 1,600 × 1,200; 1.64 MB
-
 TriosePhosphateIsomerase Ribbon pastel whitebkg.jpg 1,600 × 1,200; 1.04 MB
-
 TriosePhosphateIsomerase Ribbon pastel.jpg 1,024 × 748; 272 KB
-
 TriosePhosphateIsomerase Ribbon pastel.png 1,600 × 1,200; 3.02 MB
-
 TriosephosphateIsomerase Ribbon pastel.png 1,600 × 1,200; 3.03 MB
-
 TRNA 1ehz coil lots.jpg 600 × 489; 161 KB
-
 Twort groupI intron RNAribbon stereo.jpg 1,024 × 768; 396 KB
-
 User-flag votes vertBarChart it.png 967 × 670; 47 KB
-
 User-flag votes vertBarChart.jpg 967 × 670; 93 KB
-
 User-flag votes vertBarChart.png 967 × 670; 64 KB
-
 Validation outlier legend.jpg 1,024 × 768; 208 KB
-
 Wenxiang diagram.jpg 410 × 392; 115 KB


