Category:Economic maps of Europe
Subcategories
This category has the following 27 subcategories, out of 27 total.
Media in category "Economic maps of Europe"
The following 154 files are in this category, out of 154 total.
-
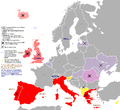
 EU regen Energien.png 1,746 × 1,236; 283 KB
-
 'ndrangehta Europe-v4.png 2,100 × 1,525; 77 KB
-
 20 oldest companies.jpg 864 × 520; 80 KB
-
 Aantal treffers GIS op internet zonder extra info.PNG 1,374 × 1,311; 655 KB
-
 Aantal treffers GIS op internet.png 1,374 × 1,518; 852 KB
-
 Agricultura ganaderia europa.png 1,242 × 1,535; 328 KB
-
 Agricultura pecuaria europa pt.png 1,242 × 1,535; 356 KB
-
 Alcohol belt.PNG 1,200 × 1,000; 46 KB
-
 Blue Golden Green Bananas in Europe.svg 464 × 363; 463 KB
-
 Bulgaria export partners.png 1,200 × 1,000; 83 KB
-
 CallingCodesEurope.svg 2,045 × 1,720; 653 KB
-
 Capital regions in Europe by nominal GDP 2017.jpg 2,152 × 2,264; 361 KB
-
 Carte de les Redevances audiovisuelle Europénnes.PNG 543 × 432; 22 KB
-
 Carte Europe de l'origine des Véhicules d'occasion Arval Trading.png 2,100 × 1,525; 89 KB
-
 Carte redevance TV en Europe.svg 680 × 520; 299 KB
-
 Coverage Small.jpg 228 × 279; 10 KB
-
 Coverage.jpg 551 × 674; 39 KB
-
 Data availability precip update.png 760 × 449; 42 KB
-
 Data availability snow depth update.png 760 × 449; 30 KB
-
 Depense-publique-sur-PIB.png 450 × 422; 13 KB
-
 Depense-publique-sur-PIB.svg 450 × 422; 82 KB
-
 DESERTEC-Map large.jpg 5,776 × 4,184; 8.61 MB
-
 Dette Europe 2012png.png 1,244 × 1,244; 157 KB
-
 Dettes et déficits publics dans l'Union européenne 2020.png 1,244 × 1,244; 183 KB
-
 Disparité socio-économiques dans l'Union européenne.png 1,900 × 1,391; 43 KB
-
 Dottedmap nov2010 cymk.jpg 428 × 439; 345 KB
-
 EEA CES.PNG 1,464 × 464; 43 KB
-
 EER NUTS-2.svg 609 × 600; 2.16 MB
-
 ElectricityUCTE eng.svg 700 × 538; 822 KB
-
 Electricityweb.svg 698 × 488; 54 KB
-
 Energy Community (2006).png 334 × 266; 9 KB
-
 ERM2SV.png 1,244 × 1,244; 90 KB
-
 Estimated Port Capacities in Europe as of 1943.jpg 7,044 × 5,800; 8.86 MB
-
 EU by GNI per capita PPP current international.jpg 4,592 × 3,196; 1.3 MB
-
 EU member states trade balance with Russia 2012.svg 1,212 × 1,242; 545 KB
-
 EUgivetake2013.svg 600 × 768; 747 KB
-
 Eurcor.png 257 × 156; 4 KB
-
 Europa PIL pro capite (2011).png 765 × 650; 53 KB
-
 Europe - TV financing.svg 9,938 × 7,945; 543 KB
-
 Europe Firefox.png 1,200 × 1,002; 470 KB
-
 Europe forestry map.png 1,475 × 1,200; 938 KB
-
 Europe gdp map-1-.png 397 × 241; 84 KB
-
 Europe Internet Explorer.png 1,360 × 1,004; 685 KB
-
 Europe minimum wage 2021.png 2,488 × 2,448; 1.05 MB
-
 Europe mobile phone penetration map v3.png 450 × 360; 86 KB
-
 Europe mobile phone penetration map.png 450 × 360; 89 KB
-
 Europe tax rates.svg 444 × 487; 723 KB
-
 Europe VAT Rates.svg 600 × 480; 708 KB
-

-

-

-
 Europe-real-GDP-growth-2015.svg 733 × 524; 308 KB
-
 European Air Group.png 550 × 551; 122 KB
-
 European Air Group.svg 680 × 520; 521 KB
-
 European countries as US states by GDP PPP per capita, 2018.jpg 3,683 × 2,850; 1.46 MB
-
 European countries as US states by Nominal GDP per capita, 2017.jpg 4,095 × 2,850; 1.57 MB
-
 European countries by average monthly net wage 2017.png 4,592 × 3,196; 932 KB
-
 European countries by average monthly net wage new.jpg 1,600 × 900; 261 KB
-
 European countries by hourly minimum wage in USD.jpg 4,592 × 3,196; 3 MB
-
 European countries by hourly minimum wage.jpg 4,095 × 2,850; 1.69 MB
-
 European countries by median wealth per adult 2021.png 4,592 × 3,196; 1.11 MB
-
 European countries with large supermarkets open on Sundays.png 2,036 × 1,313; 1.14 MB
-
 European economic areas.PNG 2,100 × 1,525; 137 KB
-
 European Fiscal Compact ratification (cropped).png 800 × 843; 206 KB
-
 EuroSpec in Europe.png 353 × 322; 4 KB
-
 Eurozone. GNI PPP per capita, PPP (current international $) World bank 2017.png 4,592 × 3,196; 735 KB
-
 FEBA - Europe.png 1,024 × 959; 358 KB
-
 FEBA-Europe-members-2015.png 613 × 626; 144 KB
-
 FEBA-Europe-members-2016.png 613 × 626; 144 KB
-
 Fitch credit rating of European countries (CS) November 2012.svg 670 × 605; 399 KB
-
 Francouzska spojka.jpg 648 × 915; 76 KB
-
 Free trade zones.png 1,208 × 1,052; 57 KB
-
 Fullneed.jpg 948 × 592; 263 KB
-
 GDP per hour worked 2020 OECD.png 4,095 × 2,850; 4.02 MB
-
 Genoese Holdings.png 6,016 × 3,148; 14.8 MB
-
 GfK Kaufkraftindex Europa 2010.png 1,000 × 1,000; 135 KB
-
 GINI Europe 2020.svg 457 × 479; 965 KB
-
 Golden Banana.svg 435 × 340; 425 KB
-
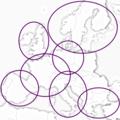
 Goldene & Blaue Banane-2.gif 767 × 700; 31 KB
-
 Goldene & Blaue Banane.gif 767 × 700; 41 KB
-
 HDP evropa 03 04.gif 789 × 700; 54 KB
-

-
 HL Damals – Possehl – Erzhandel – Transportwege.jpg 1,149 × 1,270; 326 KB
-
 Industria europa pt.png 1,535 × 1,371; 387 KB
-
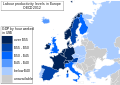 Labour productivity levels in europe.svg 744 × 524; 373 KB
-
 LG map ESTIEM.gif 1,776 × 1,299; 283 KB
-
 Map - work hours 2022.jpg 1,292 × 1,214; 175 KB
-
 Map NP.png 461 × 485; 81 KB
-
 Map of DBRS Sovereign Ratings in Europe.png 940 × 469; 88 KB
-
 Map of Europe-Mozilla Firefox.svg 690 × 690; 272 KB
-
 Map of European countries banning American pork imports in the 1880s.png 1,700 × 1,620; 533 KB
-
 Map of European countries by GDP (PPP) per capita in 2023.png 3,220 × 2,622; 872 KB
-
 Map of oldest companies in Europe; February 2020.png 1,200 × 1,331; 336 KB
-
 Map Tele2.PNG 1,245 × 1,245; 56 KB
-
 Map Tele2.svg 2,045 × 1,720; 745 KB
-
 Map Vodafone.png 1,200 × 1,001; 285 KB
-
 Mapa Evropy hustota velké podniky.PNG 1,331 × 1,910; 102 KB
-
 Mapa Evropy hustoty SME.PNG 1,331 × 1,910; 102 KB
-
 Mar Mediterranèa - Industria.png 3,518 × 1,791; 1.02 MB
-
 Market Coupling.png 686 × 430; 121 KB
-
 Meda harita.png 696 × 406; 68 KB
-
 Median wealth per adult in Europe (2019).png 4,592 × 3,196; 1.01 MB
-
 Metropolitan GDPs of Europe 2018.svg 2,592 × 2,055; 631 KB
-
 Notation financière des Etats asiatiques par S&P.svg 640 × 600; 513 KB
-
 Notation financière des Etats européens par DGCR.svg 670 × 605; 399 KB
-
 Notation financière des Etats européens par Fitch Ratings.svg 670 × 605; 402 KB
-
 Notation financière des Etats européens par Moody's.svg 715 × 645; 403 KB
-
 Notation financière des Etats européens par Standard & Poor's-2012-13-01.png 2,000 × 1,806; 553 KB
-
 Notation financière des Etats européens par Standard & Poor's.svg 670 × 605; 398 KB
-
 Number of automobile manufacturers in europe map based off wikipedia.png 982 × 683; 186 KB
-
 Number of metropolitan areas with GDP over 50 billion.png 4,592 × 3,196; 1.22 MB
-
 O2CountriesEurope.svg 680 × 520; 520 KB
-
 Pentagone européen European pentagon Mulhouse.png 738 × 756; 83 KB
-
 Pentagone européen European pentagon.png 738 × 756; 35 KB
-

-
 PRIME drink dostupnost v supermarketech.png 3,709 × 3,196; 1.09 MB
-

-
 Prostitution in Europe by countries.svg 894 × 727; 540 KB
-
 Prostitution in Europe corrected.PNG 1,200 × 1,000; 40 KB
-
 Ratio dépenses publiques et PIB.png 450 × 475; 21 KB
-
 RUPIIGSmap.png 1,358 × 1,245; 120 KB
-
 Saharaenergie.png 506 × 565; 387 KB
-
 Sdmb cobertura llengua.png 300 × 300; 67 KB
-
 Shadow economy 2013.png 328 × 202; 31 KB
-
 Shops Nederland.png 685 × 766; 85 KB
-
 Smic pays europe.png 526 × 663; 212 KB
-
 Fullplan.jpg 800 × 784; 154 KB
-
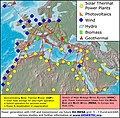
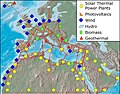 TREC-Map-en.jpg 2,000 × 1,575; 303 KB
-
 Speurope350.png 3,610 × 3,196; 1.05 MB
-
 Spotify Availability.png 1,215 × 1,245; 57 KB
-
 Spotify availability.svg 680 × 520; 520 KB
-
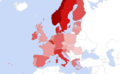
 Staatsverschuldung Europa 2010.PNG 1,200 × 960; 542 KB
-
 T-Mobile Europe dtag share 2014.png 1,395 × 599; 55 KB
-
 The republic of Finland. An economic and financial survey (1920) (14577686049).jpg 2,496 × 3,330; 1.65 MB
-
 Thevoice europe.png 1,218 × 1,245; 78 KB
-
 Tmp 29122-European countries by monthly minimum wage(before tax)(2017 March)-1331017724.png 4,592 × 3,196; 1.26 MB
-
 Top Marginal Tax Rates In Europe.webp 1,240 × 1,068; 153 KB
-
 Trade organizations in Europe by GDP.png 3,638 × 3,111; 956 KB
-
 Unternehmenssteuersätze EU25.png 1,360 × 1,245; 158 KB
-
 Vernacular architecture - Europe.png 1,036 × 988; 540 KB
-
 Voorbeeld afbeelding Europe gdp map black and white.png 341 × 179; 8 KB
-
 WiGLE map Europe.png 1,024 × 768; 105 KB
-
 Wind power installed in Europe in 2010.png 2,000 × 2,140; 523 KB
-
 Withholding tax rate - Europe map.png 4,592 × 3,196; 1,011 KB
-
 Withholding tax rate - Europe map.svg 1,148 × 800; 367 KB
-
 Wizzairdestinations.png 825 × 665; 113 KB
-
 World Bank high-income economies in Europe in 2016.png 4,592 × 3,196; 1,014 KB
-
 World Bank high-income economies in Europe in 2017.png 3,889 × 3,122; 739 KB
-
 WOSMMap-Europe.png 450 × 422; 19 KB
-
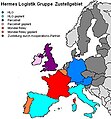 Zustellkarte HLG.jpg 395 × 425; 35 KB
-

-
 Импорт в Россию.png 3,840 × 3,841; 1.25 MB
-
 Карта офисов.jpg 2,058 × 1,334; 806 KB
-
 Карта панъевропейской сети RETN.png 1,675 × 1,001; 1.1 MB


.png)


.png)


.png)

_World_bank_2017.png)


_November_2012.svg)


_per_capita_in_2023.png)


.png)


_(14577686049).jpg)

(2017_March)-1331017724.png)


_(14782666302).jpg)


