Category:Economic trends
Subcategories
This category has the following 3 subcategories, out of 3 total.
Media in category "Economic trends"
The following 53 files are in this category, out of 53 total.
-
 2007 Combined income of returns per income bracket.png 1,024 × 300; 6 KB
-
 2007 Combined income of returns per income bracket.svg 936 × 145; 36 KB
-
 2007 income statistics c.png 6,500 × 900; 30 KB
-
 2007 Returns per income bracket.png 3,600 × 300; 8 KB
-

-
 Annual U.K. GDP Growth, 1948 to 2012 (Thatcher) (alt).png 638 × 440; 30 KB
-
 Annual U.K. GDP Growth, 1948 to 2012 (Thatcher).png 638 × 440; 32 KB
-
 Annual U.K. GDP Growth, 1948 to 2012.png 642 × 445; 29 KB
-
 Figure 1 World market energy consumption.jpg 325 × 228; 21 KB
-
 Germany-Tax-Revenues-As-GDP-Percentage-(75-05).JPG 1,412 × 737; 69 KB
-
 Germany-Tax-Revenues-As-GDP-Percentage-(85-05).JPG 503 × 305; 31 KB
-
 IcorWorld.PNG 817 × 548; 18 KB
-
 IQuoteWelt.PNG 817 × 548; 18 KB
-
 IQuoteWeltEngl.PNG 978 × 632; 34 KB
-
 NettoauslandsvermögenUSen.PNG 960 × 595; 28 KB
-
 NYUGDPFinancialShare.jpg 1,152 × 838; 56 KB
-
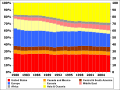
 Oil consumption per day by region from 1980 to 2006 no labels.svg 600 × 450; 98 KB
-
 Oil consumption per day by region from 1980 to 2006 original data.png 1,169 × 826; 27 KB
-
 Oil consumption per day by region from 1980 to 2006 solid2.svg 600 × 450; 134 KB
-
 Oil consumption per day by region from 1980 to 2006 solid3.svg 600 × 450; 136 KB
-
 Oil consumption per day by region from 1980 to 2006.pdf 1,239 × 1,752, 6 pages; 176 KB
-
 Oil consumption per day by region from 1980 to 2006.svg 600 × 450; 204 KB
-
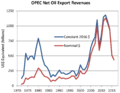 Opecrev.gif 1,687 × 1,310; 36 KB
-
 Opecrev.png 1,158 × 899; 113 KB
-
 SECTOR MONETARIO 1.png 833 × 551; 56 KB
-
 Sector monetario.jpg 832 × 548; 84 KB
-
 SECTOR.png 795 × 515; 43 KB
-
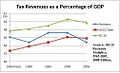
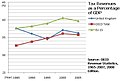
 Tax-Revenues-As-GDP-Percentage-(75-05).JPG 1,412 × 737; 105 KB
-
 U.K.-Tax-Revenues-As-GDP-Percentage-(75-05).jpg 1,412 × 737; 67 KB
-
 U.K.-Tax-Revenues-As-GDP-Percentage-(85-05).JPG 498 × 338; 28 KB
-
 U.S. Federal Tax Receipts as a Percentage of GDP 1945–2015.jpg 677 × 382; 52 KB
-
 U.S. Households By Total Yearly Income (Bar Chart) (Alt).png 825 × 428; 24 KB
-
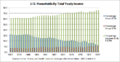
 U.S. Households By Total Yearly Income (Bar Chart).png 734 × 428; 21 KB
-
 U.S. Households By Total Yearly Income (Line Graph) (Alt).png 825 × 428; 31 KB
-
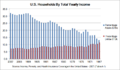
 U.S. Households By Total Yearly Income (Line Graph).png 734 × 428; 25 KB
-
 U.S.-income-taxes-out-of-total-taxes.JPG 591 × 334; 38 KB
-
 U.S.-Tax-Revenues-As-GDP-Percentage-(75-05).JPG 1,412 × 737; 68 KB
-
 U.S.-Tax-Revenues-As-GDP-Percentage-(85-05).JPG 500 × 334; 45 KB
-
 United States Commercial Paper 2001 to 2007 titles.svg 450 × 338; 78 KB
-
 United States Commercial Paper 2001 to 2007.svg 450 × 338; 28 KB
-
 United States Commercial Paper Weekly 2001 to 2008 fr.svg 450 × 338; 128 KB
-
 United States Commercial Paper Weekly 2001 to 2008 no titles.svg 450 × 338; 100 KB
-
 United States Commercial Paper Weekly 2001 to 2008 titles small.svg 450 × 338; 146 KB
-
 US annual federal deficits 1901 to 2006 redblue.svg 449 × 333; 45 KB
-
 US annual federal deficits 1901 to 2006.svg 452 × 333; 52 KB
-
 US annual federal deficits over receipts 1901 to 2006.svg 452 × 333; 65 KB
-
 US annual federal outlays 1901 to 2006 titles.svg 449 × 333; 70 KB
-
 US households by total yearly income.svg 750 × 560; 13 KB
-
 US Income Inequality 1967-2003 relative to median (log scale).svg 497 × 300; 72 KB
-
 USData47 13.png 1,754 × 1,239; 239 KB
-
 USData47 13d.png 978 × 632; 74 KB
-
 WeltBIPWorldgroupOECD.PNG 1,754 × 1,239; 249 KB
-


_(alt).png)
.png)


.JPG)
.JPG)


.JPG)
.jpg)
.JPG)

_(Alt).png)
.png)
_(Alt).png)
.png)

.JPG)
.JPG)


.svg)


