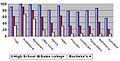
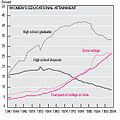
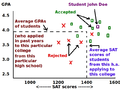
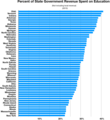
Category:Educational attainment statistics for the United States
Media in category "Educational attainment statistics for the United States"
The following 56 files are in this category, out of 56 total.
-
 04 election results by educational attainment.png 379 × 336; 7 KB
-
 04 election results by educational attainment.svg 379 × 336; 12 KB
-
 2007ACGME-2.PNG 685 × 543; 59 KB
-
 2007ACGME-3.PNG 637 × 503; 59 KB
-
 ACT-36-1997 to 2011.png 563 × 383; 15 KB
-
 Actgraph.jpg 595 × 299; 33 KB
-
 American women's earnings in 2009.png 731 × 478; 34 KB
-
 Average earnings of workers by education and sex - 2006.png 963 × 721; 57 KB
-
 CCC Historical Enrollment.jpg 799 × 519; 196 KB
-
 DO residents in ACGME total.jpg 748 × 646; 34 KB
-
 Education gender.jpg 536 × 403; 75 KB
-
 Education in the united states.gif 546 × 618; 28 KB
-
 Education Income Race.jpg 591 × 392; 110 KB
-
 Education Income Sex.jpg 583 × 371; 94 KB
-
 Education-2013.png 1,444 × 804; 519 KB
-
 Educational attainment copy.jpg 756 × 1,280; 715 KB
-
 Educational Attainment for Population 25+ by Immigration Status.png 585 × 364; 39 KB
-
 Educational attainment.jpg 679 × 725; 214 KB
-
 Educational Ranking by Religious Group - 2001-ar.png 1,023 × 598; 111 KB
-
 Educational Ranking by Religious Group - 2001.png 1,139 × 665; 47 KB
-

-
 Figure01-earnings by degree.gif 720 × 371; 48 KB
-
 Higher education in the US by race.svg 602 × 410; 313 KB
-
 Income Education 91 to 03.jpg 816 × 340; 132 KB
-
 InStateTuiton.jpg 613 × 288; 64 KB
-
 Map of states percentage of population with Advanced Degree in 2009.svg 512 × 323; 119 KB
-
-
 Mean annual income by sex and education 2012.jpg 1,588 × 963; 81 KB
-
 NAEP-longterm-Black-math-ss09-09.gif 584 × 269; 13 KB
-
 NAEP-reading-trends-race-2004.png 2,000 × 1,544; 51 KB
-
 Occupation Educational attainment.jpg 670 × 339; 119 KB
-
 Occupation educational attainment.svg 200 × 500; 7 KB
-
 OECD Skills Matter PIAAC Literacy Proficiency adults aged 25-65.png 807 × 821; 161 KB
-
 Pink 2.JPG 280 × 281; 15 KB
-
 ProjectFollowThrough01.jpg 1,231 × 676; 87 KB
-
 PSM V85 D570 Table of school standing of boys.png 1,666 × 2,262; 399 KB
-
 PSM V85 D571 Table of school standing of girls.png 1,632 × 2,233; 397 KB
-
 Scattergram by Naviance which estimates likelihood of admission.png 640 × 480; 123 KB
-
 Specialties by offered positions in US.png 1,289 × 920; 63 KB
-
 State government spending on education.png 792 × 863; 94 KB
-
 Taks standards.JPG 911 × 623; 61 KB
-
 Total US education expenditures.png 1,119 × 875; 77 KB
-

-
 United States Education Expeditures 1980-2017.png 909 × 605; 38 KB
-
 United States High School Graduation Rate 1870-2017.png 867 × 544; 38 KB
-
 United States median income by education and sex full time 25-64.svg 1,200 × 750; 5 KB
-
 US college graduate percentage by sex.svg 750 × 560; 17 KB
-
 US counties by percentage BAs.png 1,513 × 983; 197 KB
-
 US earnings by degree.svg 800 × 600; 15 KB
-
 US education attainment and spending.svg 800 × 600; 7 KB
-
 US education attainment by year.svg 800 × 600; 10 KB
-
 US educational attainment.svg 750 × 560; 14 KB
-
 US household income by education.png 600 × 416; 56 KB
-
 US household wealth by education.png 600 × 400; 56 KB
-
 US Vet school costs 99-07.GIF 483 × 355; 11 KB
-


