Category:Election cartograms of Canada
This category is for maps that represent federal and provincial election results riding by riding, i.e. using symbols of the same size in order to give a display representing seat distribution rather than geographical area held.
Media in category "Election cartograms of Canada"
The following 15 files are in this category, out of 15 total.
-
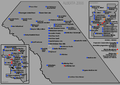 Alberta elections 2008.png 1,087 × 769; 162 KB
-
 Canada 2019 grid cartogram.png 10,800 × 5,400; 3.5 MB
-
 Canadian Federal Election Cartogram 2019.svg 1,782 × 814; 287 KB
-
 Canadian Federal Election Cartogram 2021.svg 1,782 × 814; 152 KB
-
 Canadian-Federal-2006.png 1,226 × 1,635; 93 KB
-
 Canadian-Federal-2008.png 1,226 × 1,635; 94 KB
-
 Cartogramme des élections fédérales canadiennes de 2021.svg 1,782 × 814; 287 KB
-
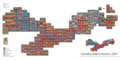
 Manitoba elections 2007.png 1,072 × 524; 113 KB
-
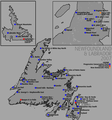 Nl elections 2007.png 870 × 929; 161 KB
-
 Tnl elections 2007.png 870 × 929; 160 KB
-
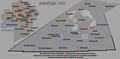
 Nwt elections 2007.png 1,050 × 742; 93 KB
-
 Tno elections 2007.png 1,050 × 742; 189 KB
-
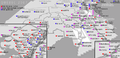
 Ontario elections 2007.png 1,500 × 1,078; 268 KB
-
 Pei elections 2007.png 607 × 300; 48 KB
-
 Quebec elections 2007.png 1,000 × 483; 245 KB


