Category:Female labour statistics
Subcategories
This category has only the following subcategory.
Media in category "Female labour statistics"
The following 53 files are in this category, out of 53 total.
-
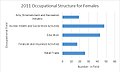 2011 females occupation.jpg 480 × 289; 27 KB
-

-

-
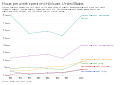
 Average hourly earnings of male and female employees, OWID.svg 850 × 600; 8 KB
-

-
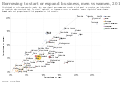 Borrowing to start or expand business, men vs women, OWID.svg 850 × 600; 33 KB
-
 Employed civilians by occupation and sex - 2007.png 928 × 686; 47 KB
-
 Female labor force by age, OWID.svg 850 × 600; 12 KB
-
-

-
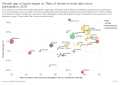
 Female labor force participation rates, 2016 vs 1980, OWID.svg 850 × 600; 32 KB
-
 Female labor force participation rates, OWID.svg 850 × 600; 8 KB
-
 Female share of employment in senior and middle management (%), OWID.svg 850 × 600; 139 KB
-
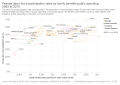
 Fertility and female labor force participation, OWID.svg 850 × 600; 100 KB
-
-
 Hours per week spent in leisure, by sex, United States, OWID.svg 850 × 600; 8 KB
-
 Hours per week spent on child care, United States, OWID.svg 850 × 600; 9 KB
-

-

-

-

-

-
 Occupation data (1881).jpg 480 × 289; 26 KB
-
 Occupation Graph Parham -1881.jpg 527 × 356; 39 KB
-
 Occupation of Males and Females in 1881 , Layer Breton .png 481 × 288; 9 KB
-
 Occupation of males and females in Langdon in 1881..jpg 650 × 400; 43 KB
-
 Occupation of the Residents of Winwick in 1881.png 752 × 453; 44 KB
-
 Occupation of the Residents of Winwick, 2011.jpg 752 × 452; 36 KB
-
 Occupation Structure concerning 1881 Census.png 481 × 289; 9 KB
-
 Occupation Structure.png 481 × 289; 10 KB
-

-
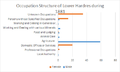
 Occupational Structure for females in Ramsden Crays 1881.png 691 × 865; 67 KB
-
 Occupational structure for females in Ramsden Crays 2011.png 588 × 491; 32 KB
-
 Occupational structure in Sutton, 1881.jpg 480 × 318; 31 KB
-
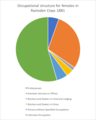
 Occupational Structure of Females in 1881.jpg 659 × 460; 48 KB
-
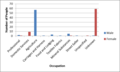
 Occupations for Males and Females in 2011.jpg 361 × 217; 20 KB
-
 Occupations of Females in 2011.jpg 360 × 217; 20 KB
-
 Occupations of males and females in 1881 in Beighton.png 1,323 × 860; 91 KB
-
 Occupations of Males and Females in Hunton 1881.jpg 900 × 284; 43 KB
-
 Occupations of men and women in Moor Crichel in 1881.jpg 666 × 475; 66 KB
-
 Occupations of Newborough 2011.png 1,040 × 625; 76 KB
-
 Occupations of Newborough in 1881.png 1,053 × 644; 56 KB
-
 Percentage of firms with a top female manager, OWID.svg 850 × 600; 141 KB
-
 Proportion of labor force who are women, OWID.svg 850 × 600; 140 KB
-
 Proportion of women in senior and middle management positions, OWID.svg 850 × 600; 140 KB
-
 Proportion of women participating in the labor force, OWID.svg 850 × 600; 32 KB
-
 Ratio of female to male labor force participation rates (%), OWID.svg 850 × 600; 142 KB
-
 Ratio of female to male labor force participation rates, OWID.svg 850 × 600; 24 KB
-
 Ratio of female-to-male median earnings by age, US, OWID.svg 850 × 600; 11 KB
-
 Share of people who prefer a male vs a female boss, OWID.svg 850 × 600; 6 KB
-
 Unemployment rate of males vs. females, OWID.svg 850 × 600; 44 KB
-

-
 Women in workforce.png 1,080 × 551; 277 KB


,_OWID.svg)


,_OWID.svg)


_(modeled_ILO_estimate)_vs._GDP_per_capita,_OWID.svg)


.jpg)


,_OWID.svg)


