Category:Files uploaded from Global Systems Institute Wikimedian in Residence project activities
Subcategories
This category has the following 4 subcategories, out of 4 total.
C
- Climate Visuals upload (323 F)
G
- Global Systems Institute (7 F)
O
- OWID climate graphics upload (900 F)
Media in category "Files uploaded from Global Systems Institute Wikimedian in Residence project activities"
The following 75 files are in this category, out of 75 total.
-
 Antarctic-sea-ice-extent 2016-2023.jpg 1,240 × 640; 135 KB
-
 ClimateDashboard-Antarctic-sea-ice-summer-minimum-graph-20230307-1400px.jpg 1,400 × 1,200; 252 KB
-
 ClimateDashboard-global-sea-levels-graph-20230329-1400px.png 1,400 × 1,200; 88 KB
-
 Fig 1 Forcing a system past a tipping point.png 1,024 × 336; 8 KB
-
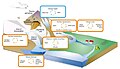
 Fig 1 Parts of the Earth system featuring tipping points.jpg 3,098 × 2,057; 2.19 MB
-
-
 Fig 1.2.13 Map of estimated organic carbon storage.png 820 × 808; 561 KB
-

-
 Fig 1.2.16 Increasing risks for cryosphere tipping elements.png 585 × 666; 99 KB
-
 Fig 1.2.2 Map of cryosphere systems considered in this chapter.png 988 × 677; 99 KB
-

-
 Fig 1.2.7 Arctic sea ice evolution 1979-2023..png 666 × 316; 133 KB
-

-
 Fig 1.2.9 Antarctic sea ice evolution 1979-2023.png 666 × 319; 115 KB
-
 Fig 1.3.1 Map of biosphere systems considered in this chapter.png 666 × 460; 268 KB
-

-
 Fig 1.3.3 Diagram with positive amplifying feedback loops.png 666 × 520; 93 KB
-
 Fig 1.3.5 A conceptual regional transect from moist.png 3,840 × 2,067; 6.71 MB
-
 Fig 1.3.8 Key feedbacks that could lead to savanna tipping..png 666 × 359; 67 KB
-
 Fig 1.4.1 Atmospheric circulation cells, dominant wind directions.png 666 × 277; 139 KB
-
 Fig 1.4.10 The role of clouds in regulating Earth’s radiation budget.png 1,024 × 541; 31 KB
-

-

-
 Fig 1.4.3 Overview over the major oceanic circulation systems in the North Atlantic.png 5,995 × 3,175; 2.05 MB
-
 Fig 1.4.4 AMOC in CMIP models.png 1,024 × 400; 56 KB
-

-
 Fig 1.5.2 Interactions between tipping systems across scales in space and time..jpg 2,662 × 1,782; 1,015 KB
-

-
 Fig 1.6.3 Map of studies that use empirical data to look for early warning signals.jpg 3,508 × 2,355; 1.93 MB
-
 Fig 2 Three types of tipping points.png 1,024 × 996; 57 KB
-
 Fig 2 Visual summary of the concept of positive tipping points.png 1,024 × 375; 16 KB
-

-

-
 Fig 2.4.10 Tipping cascade in Lake Chad.png 666 × 625; 132 KB
-
 Fig 2.4.5 Unique topic clusters generated using BERTopic.png 666 × 416; 106 KB
-
 Fig 2.4.6 Tipping cascades in the Amazon rainforest..png 666 × 515; 107 KB
-
 Fig 2.4.7 Tipping cascades in coral reefs and small-scale fisheries..png 666 × 602; 167 KB
-
 Fig 2.4.8 Tipping cascades in migration..png 666 × 590; 154 KB
-
 Fig 2.4.9 Tipping cascades in the Arab Spring.png 666 × 603; 133 KB
-
 Fig 3 A simple representation of hystersis.png 1,024 × 266; 8 KB
-
 Fig 3.1.1 Temporal diversity of Earth system tipping processes..png 666 × 451; 115 KB
-

-
 Fig 3.2.2 Proposed engineering techniques at tipping-point scale.png 3,316 × 1,802; 127 KB
-
 Fig 3.3.1 3 Phases of ESTP impact governance..png 666 × 666; 175 KB
-
 Fig 3.3.3 Multi-level, multi-phase ESTPl impact governance..png 3,721 × 2,093; 976 KB
-

-
 Fig 4 Early indicators before a tipping point.png 666 × 600; 85 KB
-
 Fig 4.2.1 PTP domains..png 613 × 636; 75 KB
-

-
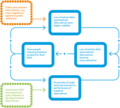 Fig 4.3.10 Positive feedbacks can drive changes in dietary norms.png 666 × 600; 96 KB
-
 Fig 4.3.11 Positive feedbacks initiated by the TIST programme.png 666 × 664; 121 KB
-

-

-
 Fig 4.3.4 ICEV Market Share in the Europe, Asia and the USA.png 666 × 396; 37 KB
-

-

-
-

-

-

-
 Fig 4.4.4 Sequence of rapid social change..png 973 × 502; 71 KB
-

-

-

-

-

-
 GSI Editathon Jan POSTER (1).jpg 1,587 × 2,245; 383 KB
-
 Illustration different solar climate intervention techniques.png 2,424 × 1,651; 2.53 MB
-
Methane emissions from wetlands.webm 1 min 55 s, 1,920 × 1,080; 14.77 MB
-
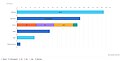 Sources of methane emissions, 2021.jpg 1,648 × 832; 85 KB
-
 Sources-of-methane-emissions-2021 (1).png 1,200 × 1,000; 25 KB
-
 Sources-of-methane-emissions.png 1,200 × 1,000; 25 KB
-
 The archaeology of climate change, figure 2.jpg 2,336 × 1,875; 490 KB
-
 Wetland archaeology and the impact of climate change, figure 4.png 1,583 × 1,056; 1.5 MB
-
 WhereIsTheHeatOfGlobalWarming2023.svg 669 × 422; 5 KB


_and_associated_negative_social_tipping_processes.png)


_and_on_governance_institutions.png)

.jpg)


.png)


