Category:Financial derivatives graphs
Media in category "Financial derivatives graphs"
The following 17 files are in this category, out of 17 total.
-
 American binary put.png 648 × 419; 6 KB
-
 BICs Exchange.jpg 1,200 × 1,586; 225 KB
-
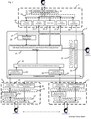 BICs Exchange.pdf 1,200 × 1,575; 38 KB
-
 Black-Scholes Bear.gif 908 × 615; 927 KB
-
 Black-Scholes Bull.gif 908 × 615; 908 KB
-
 Black-Scholes Butterfly.gif 917 × 609; 1,012 KB
-
 Black-Scholes Call.gif 900 × 620; 807 KB
-
 Black-Scholes Collar.gif 917 × 609; 778 KB
-
 Black-Scholes Put.gif 903 × 618; 752 KB
-
 Black-Scholes Straddle.gif 903 × 618; 847 KB
-
 Combined Price Data for Five TVSs and Underlying ($).png 924 × 655; 60 KB
-
 Price Candlestick Charts (US$) and SMA(50).png 939 × 642; 511 KB
-

-
 Securities Performance (Limited to -100% to +100%).png 895 × 757; 188 KB
-
 Tranched Value Securities General Principle.png 1,940 × 1,758; 2.04 MB
-
 TVS Default Rates (When Price Equals to Zero).png 623 × 1,169; 95 KB
-
 Why is long option Gamma positive.png 640 × 400; 26 KB


.png)
_and_SMA(50).png)
_and_Returns_(%25)_of_Underlying_(St),_Senior_Tranched_Value_Security_(TVS_SEN),_and_Secondary_Tranched_Value_Security_(TVS_SEN).png)
.png)

.png)
