Category:GDP maps of the world
Media in category "GDP maps of the world"
The following 169 files are in this category, out of 169 total.
-
 2005gdp.PNG 1,425 × 625; 60 KB
-
 2006gdp ppp.PNG 1,425 × 625; 62 KB
-
 2011 CIA GDP NOMINAL figures.png 1,350 × 625; 54 KB
-
 2011 CIAGDP NOMINAL figures.png 1,350 × 625; 54 KB
-
 2016 GDP comparison by country or US state.png 6,460 × 3,455; 1.46 MB
-
 Countries by Real GDP Growth Rate in 2018.png 6,300 × 3,800; 1.57 MB
-
 2020 California economy compared to rest of U.S. and other countries.png 6,288 × 3,248; 1.67 MB
-
 2021 GDP per capita world map.png 6,459 × 3,403; 4.72 MB
-
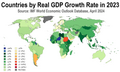 Countries by Real GDP Growth Rate in 2023.png 6,816 × 4,085; 2.67 MB
-
 Average GDP PPP per capita 2010.svg 2,711 × 1,194; 1.41 MB
-
 Average GDP PPP per capita new.svg 940 × 415; 1.59 MB
-
 Average GDP PPP per capita.PNG 1,350 × 625; 48 KB
-
 Average GDP PPP per capita.svg 940 × 415; 1.59 MB
-
 BIP-Weltkarte-2006-de.svg 940 × 477; 1.76 MB
-
 BNP perhoofd 2007.png 1,350 × 625; 51 KB
-
 BNP perhoofd 2009.png 1,350 × 625; 37 KB
-
 BNP perhoofd 2010.png 1,350 × 625; 37 KB
-
 BNP perhoofd 2011-2.png 1,350 × 625; 56 KB
-
 BNP perhoofd 2012.PNG 1,350 × 625; 38 KB
-
 BNP perhoofd 2013.png 1,350 × 625; 38 KB
-
 BNPperhoofd2013-2019.png 1,350 × 1,250; 104 KB
-
 BNPperhoofd2013.png 1,350 × 625; 38 KB
-
 Capita2012.png 1,350 × 652; 49 KB
-
 Capita2013PPA.png 1,350 × 652; 58 KB
-
 China vs World by Nominal GDP per capita in 2019.jpg 6,276 × 3,217; 2.8 MB
-
 China vs World by Nominal GDP per capita in 2020 new.png 6,460 × 3,480; 1.72 MB
-
 Countries & Territories by estimated PPP GDP in 2020.png 6,300 × 3,095; 1.63 MB
-
 Countries by GDP (Nominal) in 2014.svg 863 × 396; 1.19 MB
-
 Countries by GDP (nominal) per capita in 2019.svg 2,911 × 1,297; 2.08 MB
-
 Countries by GDP (nominal).svg 2,754 × 1,398; 1.06 MB
-
 Countries by GDP (PPP) Per Capita in 2015.svg 863 × 396; 1.12 MB
-
 Countries by GDP (PPP) per capita in 2017.png 6,300 × 3,082; 1.93 MB
-
 Countries by GDP (PPP) per capita in 2019.png 5,990 × 2,740; 1.54 MB
-
 Countries by GDP (PPP) per capita in 2020 (new).png 7,192 × 3,318; 2.13 MB
-
 Countries by GDP (PPP) per capita in 2020.png 5,990 × 2,740; 1.25 MB
-
 Countries by GDP nominal per capita(2016).jpg 6,300 × 3,095; 1.74 MB
-
 Countries by GDP nominal per capita.jpg 6,300 × 3,140; 1.67 MB
-
 Countries by GDP per Capita (PPP, 2012).svg 863 × 443; 1.67 MB
-
 Countries by Nominal GDP.jpg 6,460 × 3,480; 2.77 MB
-
 Countries by Real GDP Growth Rate in 2018 (Armenian).png 2,048 × 1,235; 628 KB
-
 Countriesbygdpnominal2018.png 1,425 × 625; 3.41 MB
-
 Country subdivisions by GDP over 200 billion USD.png 5,753 × 2,999; 4.65 MB
-
 Direct-disaster-loss-as-a-share-of-gdp.png 3,400 × 2,400; 819 KB
-
 External debt to gdp.png 1,946 × 886; 160 KB
-
 GDP (nominal) per capita map.png 940 × 415; 135 KB
-
 GDP (PPP) 2022 World Map (June 2024 Recolor).svg 2,754 × 1,398; 2.5 MB
-
 GDP (PPP) 2022 World Map.svg 2,754 × 1,398; 2.5 MB
-
 GDP (PPP) by country.svg 2,754 × 1,398; 1.45 MB
-
 GDP (PPP) of Countries (EU as a single entity).svg 2,754 × 1,398; 1.11 MB
-
 GDP (PPP) of Countries.svg 2,560 × 1,134; 1.01 MB
-
 GDP (PPP) per capita 2012 - IMF.png 3,600 × 1,640; 1.5 MB
-
 GDP (PPP) per capita by countries.png 1,425 × 625; 67 KB
-
 GDP (PPP) per capita, 2012 IMF.jpg 3,600 × 1,640; 534 KB
-
 Gdp 2004 by PPP world.PNG 1,541 × 1,381; 72 KB
-
 Gdp 2005 by PPP world.PNG 1,515 × 628; 57 KB
-
 Gdp 2006 by PPP world.svg 940 × 477; 1.66 MB
-
 GDP 2018 (nominal).svg 863 × 443; 1.56 MB
-
 GDP circles.png 1,977 × 1,000; 294 KB
-
 Gdp growth rate for 2013.PNG 1,350 × 625; 36 KB
-
 GDP in dollars worldmap-2015.svg 940 × 477; 1.86 MB
-
 Gdp nominal 2000 world map.PNG 1,515 × 628; 61 KB
-
 Gdp nominal 2004 world map.PNG 1,541 × 1,381; 72 KB
-
 Gdp nominal 2005 world map.PNG 1,515 × 630; 58 KB
-
 Gdp nominal 2006 estimated world map.png 1,515 × 630; 65 KB
-
 Gdp nominal 2006 world map.PNG 1,515 × 630; 68 KB
-
 GDP Nominal 2022.png 6,460 × 3,403; 1.5 MB
-
 Gdp nominal and ppp 2004 world map.PNG 1,541 × 1,381; 72 KB
-
 Gdp nominal and ppp 2005 world map single colour (1).png 1,541 × 1,283; 114 KB
-
 Gdp nominal and ppp 2005 world map single colour.png 1,541 × 1,283; 104 KB
-
 Gdp nominal and ppp 2005 world map.PNG 1,541 × 1,283; 102 KB
-
 GDP nominal per capita world map IMF 2007.PNG 1,350 × 625; 52 KB
-
 GDP nominal per capita world map IMF 2008.png 1,800 × 820; 187 KB
-
 GDP nominal per capita world map IMF 2008.svg 940 × 415; 1.43 MB
-
 GDP nominal per capita world map IMF 2009.png 1,350 × 625; 51 KB
-
 GDP nominal per capita world map IMF figures for year 2004.png 2,250 × 1,117; 170 KB
-
 GDP nominal per capita world map IMF figures for year 2005.png 2,250 × 1,117; 176 KB
-
 GDP nominal per capita world map IMF figures for year 2006.png 2,250 × 1,117; 170 KB
-
 GDP of the world in 1800.png 1,202 × 571; 176 KB
-
 GDP per capita (nominal) 2011.png 1,350 × 625; 38 KB
-
 GDP per capita (nominal) 2014.png 1,350 × 625; 38 KB
-
 GDP per capita (nominal) 2015.png 1,350 × 625; 49 KB
-
 GDP per capita -2006-blank.svg 940 × 477; 2.26 MB
-
 Gdp per capita 1965.png 1,280 × 597; 196 KB
-
 GDP per capita growth 2023.png 7,664 × 4,680; 2.47 MB
-
 Gdp per capita ppp world map 2005 copy one colour.png 1,400 × 714; 48 KB
-
 Gdp per capita ppp world map 2005.PNG 1,357 × 714; 50 KB
-
 Gdp per capita ppp world map.PNG 1,788 × 881; 40 KB
-

-
 GDP Per Capita, 2018.png 3,400 × 2,400; 791 KB
-
 GDP per capita-worldmap-2006.svg 940 × 477; 2.27 MB
-
 GDP per capita.png 1,800 × 820; 145 KB
-
 Gdp ppp 2011 worldbank.png 1,351 × 741; 45 KB
-
 GDP PPP per capita 2007 CIA.png 1,500 × 630; 69 KB
-
 GDP PPP per capita 2007 IMF.png 1,500 × 630; 49 KB
-
 GDP PPP per capita 2007 WB.png 1,500 × 630; 69 KB
-
 GDP PPP per capita 2009 IMF.png 1,500 × 630; 70 KB
-
 GDP PPP per capita 2012 world.jpg 2,520 × 1,252; 411 KB
-
 GDP PPP per capita 2012.jpg 3,150 × 1,564; 561 KB
-
 GDP PPP per capita 2017 IMF.png 1,500 × 630; 64 KB
-
 GDP PPP Per Capita IMF 2008.png 1,800 × 820; 186 KB
-
 GDP PPP Per Capita IMF 2008.svg 1,800 × 820; 1.03 MB
-
 GDP PPP per capita IMF.png 1,410 × 640; 40 KB
-
 GDP PPP per capita world map IMF figures for year 2006.png 2,250 × 1,117; 163 KB
-
 GDP PPP per capita world map IMF figures year 2006(2).png 1,357 × 714; 50 KB
-
 GDP PPP Per Capita Worldmap 2007 CIA factbook.PNG 1,350 × 625; 48 KB
-
 GDP PPP Per Capita Worldmap 2008 CIA Factbook.svg 940 × 415; 1.64 MB
-
 GDP(MMR).png 1,800 × 820; 191 KB
-
 GDP, 2018.png 1,650 × 1,050; 340 KB
-
 GDP-2014-symbol-en-01.svg 1,024 × 558; 462 KB
-
 GDP-2014-symbol-fr-01.svg 1,024 × 558; 421 KB
-
 GDP-worldmap-2006-es.svg 940 × 477; 2.27 MB
-
 Gdpercapita Russia.png 1,350 × 739; 48 KB
-
 Gdpercapita.PNG 1,350 × 739; 46 KB
-
 GDPPPPPercapita2009WorldBan.svg 940 × 477; 1.27 MB
-
 GDP(PPP).png 1,800 × 820; 140 KB
-
 Global Gas trade both LNG and Pipeline-ar.png 1,190 × 863; 239 KB
-
 Global Gas trade both LNG and Pipeline.png 1,190 × 863; 246 KB
-
 Gross Domestic Product (World Bank (1960 to 2017)), OWID.svg 850 × 600; 147 KB
-
 Highincome countries by gdp ppp.png 2,753 × 1,400; 128 KB
-
 IMF GDP PPP per capita by country (Oct 2022).png 2,640 × 1,585; 555 KB
-
 IMF Real GDP growth by country (Oct 2022).png 2,640 × 1,585; 575 KB
-
 India vs World by Nominal GDP per capita in 2020.png 6,460 × 3,480; 1.98 MB
-
 Manufacturing-value-added-to-gdp.png 3,400 × 2,400; 807 KB
-
 Map GDP PPP 2012 per capita.jpg 4,500 × 2,234; 957 KB
-
 Map of countries by GDP (nominal) in US$.png 1,435 × 625; 48 KB
-
 Map of countries by GDP (nominal) per capita in 2021.svg 2,192 × 1,135; 1.62 MB
-
 Map of countries by GDP (nominal) per capita in 2022.svg 2,192 × 1,135; 2.18 MB
-
 Map of countries by GDP (nominal) per capita in 2023.svg 2,192 × 1,135; 1.64 MB
-
 Map of countries by GDP (PPP) per capita in 2021.svg 2,192 × 1,135; 1.62 MB
-
 Map of countries by GDP (PPP) per capita in 2022 by IMF v2.png 2,192 × 1,135; 519 KB
-
 Map of countries by GDP (PPP) per capita in 2022 by IMF.png 2,192 × 1,135; 509 KB
-
 Map of countries by GDP (PPP) per capita in 2022.svg 2,192 × 1,135; 1.64 MB
-
 Map of countries by GDP (PPP) per capita in 2023.svg 2,192 × 1,135; 1.64 MB
-
 Map of countries by GDP (PPP) per capita in 2024.svg 2,192 × 1,135; 1.7 MB
-
 Map of European countries by GDP (PPP) per capita in 2021.svg 440 × 319; 671 KB
-
 Map of European countries by GDP (PPP) per capita.svg 469 × 341; 672 KB
-
 Map of GDP(PPP).png 1,435 × 679; 41 KB
-
 Map of GDP(PPP).svg 863 × 443; 1.22 MB
-
 Map of world countries by GDP (nominal) in US$-ar.png 1,435 × 625; 69 KB
-
 Map of world countries by GDP (nominal) in US$.png 1,435 × 625; 48 KB
-
 MERandPPP.png 724 × 684; 174 KB
-
 Muh.png 1,350 × 625; 35 KB
-
 Nominal GDP of Countries.svg 2,754 × 1,398; 1.05 MB
-
 Oil rents map.svg 863 × 443; 1.69 MB
-
 PBI nominal 2008 mapa.JPG 1,369 × 628; 314 KB
-
 PDRB Provinsi di Indonesia 2016.png 1,322 × 620; 134 KB
-
 PIB per capita Paridade de Poder de Compra, 2022.png 2,840 × 1,705; 768 KB
-
 Ratio of GDP to carbon dioxide emissions.PNG 1,347 × 628; 31 KB
-
 Real GDP growth rate (%) in 2017.png 6,300 × 3,520; 2.11 MB
-
 Share of world gdp 2012 imf.png 1,562 × 892; 96 KB
-
 Spending on research and development as share of GDP, OWID.svg 850 × 600; 141 KB
-
 Total natural resources rents map.svg 863 × 443; 1.7 MB
-
 Total-government-revenue-of-gdp 2017.png 3,400 × 2,400; 718 KB
-
 Total-government-revenue-of-gdp 2020.png 3,400 × 2,400; 816 KB
-
 Trade-as-share-of-gdp.png 3,400 × 2,400; 792 KB
-
 USA-World Nominal GDP-ar.png 6,297 × 3,147; 1.71 MB
-
 USA-World Nominal GDP.PNG 5,432 × 3,300; 2.33 MB
-
 USA-World Nominal GDP.png 1,407 × 663; 49 KB
-
 Voorbeeld afbeelding USA-World Nominal GDP black and white.png 1,407 × 663; 70 KB
-
 World gdp 2007 b.png 1,500 × 818; 276 KB
-
 World gdp per country 2012.png 2,468 × 1,977; 389 KB
-
 World map GDP per capita.svg 1,405 × 601; 389 KB
-
-

-
-
 World map showing nominal GDP of countries for the year 2017 according to the IMF.png 6,460 × 3,480; 2.09 MB
-
 World Nominal GDP 2010.svg 940 × 414; 1.41 MB
-
 WorldPBI-PPA.PNG 940 × 477; 278 KB
-
 ´World Bank, icp 2011 gdp ppp world share.png 2,684 × 1,926; 497 KB


_in_2014.svg)
_per_capita_in_2019.svg)
.svg)
_Per_Capita_in_2015.svg)
_per_capita_in_2017.png)
_per_capita_in_2019.png)
_per_capita_in_2020_(new).png)
_per_capita_in_2020.png)
.jpg)

.svg)

.png)


_per_capita_map.png)
_2022_World_Map_(June_2024_Recolor).svg)
_2022_World_Map.svg)
_by_country.svg)
_of_Countries_(EU_as_a_single_entity).svg)
_of_Countries.svg)
_per_capita_2012_-_IMF.png)
_per_capita_by_countries.png)
_per_capita,_2012_IMF.jpg)


.svg)


.png)


_2011.png)
_2014.png)
_2015.png)


.png)


.png)


),_OWID.svg)

.png)
.png)


_in_US$.png)
_per_capita_in_2021.svg)
_per_capita_in_2022.svg)
_per_capita_in_2023.svg)
_per_capita_in_2021.svg)
_per_capita_in_2022_by_IMF_v2.png)
_per_capita_in_2022_by_IMF.png)
_per_capita_in_2022.svg)
_per_capita_in_2023.svg)
_per_capita_in_2024.svg)
_per_capita_in_2021.svg)
_per_capita.svg)
.png)
.svg)
_in_US$-ar.png)
_in_US$.png)


_in_2017.png)


