Category:Geology of Bedford & Berea Posted by CLight
Media in category "Geology of Bedford & Berea Posted by CLight"
The following 51 files are in this category, out of 51 total.
-
 Fig 01 Sketch map.jpg 715 × 1,110; 151 KB
-
 Fig 02 Representative sections.jpg 1,344 × 1,625; 191 KB
-
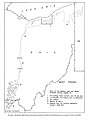 Fig 03 Sketch map.jpg 1,328 × 1,765; 153 KB
-
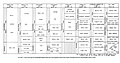 Fig 04 Chart of.jpg 1,803 × 952; 213 KB
-
 Fig 05 Sketch map.jpg 753 × 1,528; 245 KB
-
 Fig 06 Schematic cross section.jpg 1,270 × 308; 56 KB
-
 Fig 07 Sketch map.jpg 1,256 × 1,080; 123 KB
-
 Fig 08 Sketch map.jpg 704 × 1,412; 113 KB
-
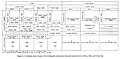 Fig 09 Correlation chart of.jpg 1,403 × 695; 134 KB
-
 Fig 10 Sketch map.jpg 1,331 × 984; 98 KB
-
 Fig 11 Sketch map.jpg 1,070 × 1,717; 158 KB
-
 FIg 12 Correlation of.jpg 1,236 × 935; 238 KB
-
 Fig 13 Sketch map.jpg 751 × 1,103; 156 KB
-
 Fig 14 North wall of the Buckeye quarry, South Amherst.jpg 1,339 × 875; 146 KB
-
 Fig 15 North wall of the Buckeye quarry.jpg 1,365 × 926; 173 KB
-
 Fig 16 Nicholl quarry at Kipton, Camden Township, Lorain County.jpg 1,355 × 909; 177 KB
-
 Fig 17 Pebbles of iron-stained siltstone.jpg 1,343 × 872; 140 KB
-
 Fig 18 Hermit's cave.jpg 1,352 × 836; 163 KB
-
 Fig 19 Outcrop of the black Sunbury shale.jpg 1,344 × 972; 207 KB
-
 Fig 20 Sketch showing three phases.jpg 1,410 × 648; 84 KB
-
 Fig 21 Section so the Berea sandstone in northeastern Ohio.jpg 1,394 × 1,033; 185 KB
-
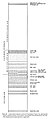 Fig 22 generalized columnar section of Washington County, PA.jpg 794 × 1,744; 129 KB
-
 Fig 23 Generalized cross section showing the relation of the siltstones.jpg 1,819 × 436; 90 KB
-
 Fig 24 Correlations between ne Ohio and nw Pennsylvania.jpg 1,812 × 827; 145 KB
-
 Fig 25 Sketch map showing the relation of the sandstones.jpg 728 × 798; 155 KB
-
 Fig 26 Map showing the area of the Hungry Run sandstone.jpg 1,165 × 1,530; 213 KB
-
 Fig 27 Diagram showing the areal extent of the Red Bedford Delta.jpg 706 × 1,110; 84 KB
-
 Fig 28 Diagram showing the similarity of stream channels.jpg 1,265 × 1,666; 198 KB
-
 Fig 29 Lower Mississippi delta and profile.jpg 738 × 731; 64 KB
-
 Fig 30 Cross sections of three partly aggraded stream valleys.jpg 1,228 × 825; 112 KB
-
 Fig 31 Sketch map showing the relations of the red sediments.jpg 699 × 1,067; 73 KB
-
 Fig 32 Map of the Second Berea bar.jpg 1,278 × 1,827; 343 KB
-
 Fig 33 Map of area in southwestern Trumbull County.jpg 1,278 × 1,729; 228 KB
-
 Fig 34 Approximate area of Cussewago.jpg 1,281 × 1,797; 245 KB
-
 Fig 35 Map showing the different areas of silt or sand deposition.jpg 1,030 × 1,810; 199 KB
-
 Fig 36 Bedford shale and Berea sandstone.jpg 1,344 × 895; 174 KB
-
 Fig 37 East end of the scour channel shown in figure 36.jpg 1,339 × 914; 220 KB
-
 Fig 38 Close-up of the contact of the channel sandstone.jpg 1,352 × 883; 218 KB
-
 Fig 39 Map of a part of Lorain County.jpg 692 × 1,779; 99 KB
-
 Fig 40 Current ripple marks.jpg 1,335 × 908; 177 KB
-
 Fig 41 Current ripple marks in a block of Berea sandstone.jpg 700 × 846; 84 KB
-
 Fig 42 Cross section of the current ripple marks.jpg 716 × 810; 79 KB
-
 Fig 43 Map and cross section of the Buckeye quarry.jpg 1,423 × 1,751; 356 KB
-
 Fig 44 Schematic diagram.jpg 1,306 × 1,783; 232 KB
-
 Fig 45 Diagram showing the three major trends.jpg 692 × 962; 85 KB
-
 Fig 46 Diagram comparing the Second Berea bar and the Gay-Fink Channel.jpg 1,440 × 1,323; 132 KB
-

-
 Fig 48 Sketch map showing the areas of ripple marks.jpg 1,230 × 1,427; 198 KB
-
 Fig 48 Two sections across the sand body at Cabin Creek.jpg 1,462 × 1,686; 180 KB
-
 Fig 50 Oscillation ripple marks.jpg 1,326 × 756; 125 KB
-
 Fig 51 Oscillation ripple marks.jpg 1,334 × 763; 117 KB


