Category:Global mean temperature 1961-1990 – CRU CL 2.0 (Mollweide monthly, red)
Animated global map of monthly long term mean surface air temperature 1961-1990 (Mollweide projection).
Sources: CRU CL 2.0 (New, M., Lister, D., Hulme, M. and Makin, I., 2002: A high-resolution data set of surface climate over global land areas. Climate Research 21: 1–25), NCEP/NCAR Reanalysis Derived data v. 1 provided by the NOAA/OAR/ESRL PSD, Boulder, CO (Kalnay et al., 1996: The NCEP/NCAR 40-Year Reanalysis Project. Bulletin of the American Meteorological Society 77 (3): 437–471.), World Coast Line.
Media in category "Global mean temperature 1961-1990 – CRU CL 2.0 (Mollweide monthly, red)"
The following 4 files are in this category, out of 4 total.
-
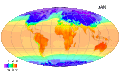 MonthlyMeanT.gif 550 × 340; 405 KB
-
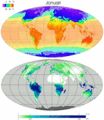
 Earth Climate.gif 550 × 632; 875 KB
-
 Earth Climate Swedish.gif 550 × 632; 1 MB
-
 MonthlyMeanT DEC.jpg 550 × 340; 36 KB


