Category:Gross domestic product bar charts
Media in category "Gross domestic product bar charts"
The following 84 files are in this category, out of 84 total.
-
 2000-2011中国GDP增长率.jpg 1,000 × 438; 101 KB
-
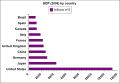
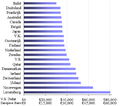
 2010 Nominal GDP.jpg 470 × 278; 19 KB
-
 BERD as a share of GDP in the EU, 2005 and 2013.svg 501 × 357; 2.34 MB
-
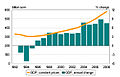
 BIP Wachstum China.png 532 × 245; 9 KB
-
 BIP Wachstum EU.png 892 × 691; 18 KB
-
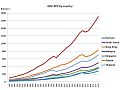
 BIP Wachstum USA.png 512 × 235; 7 KB
-
 Canada GDP.jpg 718 × 429; 45 KB
-
 Composition of GDP in sub-Saharan Africa by economic sector, 2013.svg 647 × 894; 1.04 MB
-
 DebtGDPUkraine.PNG 861 × 628; 70 KB
-
 Democratic Republic of the Congo GDP evolution-fr.svg 730 × 504; 313 KB
-
 Econ collapse.png 894 × 368; 8 KB
-
 Ee real gdp growth-2.svg 1,350 × 900; 47 KB
-
 Ee real gdp growth.svg 1,350 × 900; 44 KB
-
 EU-GDP-PPP-pc.png 955 × 653; 20 KB
-
 EU-GDP-PPP.png 955 × 653; 19 KB
-
 European union gdp diagram de.png 500 × 620; 9 KB
-
 European-union-gdp-diagram-de.svg 1,450 × 1,400; 6 KB
-
 Eurostat GNP EU28 Finland.png 542 × 360; 38 KB
-
 Evolucao pib 1995-2014.jpg 1,621 × 852; 286 KB
-
 Fi real gdp growth.svg 1,350 × 900; 42 KB
-
 GDP 2006 en.svg 481 × 333; 67 KB
-
 Gdp accumulated change.png 1,100 × 614; 77 KB
-
 GDP by economic sector in the CARICOM countries 2012.svg 243 × 357; 2.93 MB
-
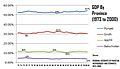 GDP by Province.jpg 1,916 × 1,108; 145 KB
-
 GDP from the IMF 2012.png 1,010 × 507; 23 KB
-
 GDP in Central Asia by economic sector, 2005 and 2013.svg 316 × 764; 1.06 MB
-
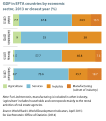 GDP in EFTA countries by economic sector, 2013 or closest year.svg 237 × 269; 1.32 MB
-

-
 GDP nominal 2010 2050.jpg 478 × 285; 19 KB
-
 GDP per capita 2006.svg 480 × 335; 74 KB
-
 GDP per capita and GDP growth rate for Brazil, 2003–2013.svg 497 × 271; 4.67 MB
-

-
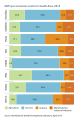 GDP per economic sector in South Asia, 2013.svg 252 × 384; 1 MB
-

-
 GDP per head Europe 1937.png 817 × 646; 43 KB
-
 GDP-PPP By Country.jpg 960 × 720; 64 KB
-
 GDP-PPP per Capita by country.png 773 × 492; 23 KB
-
 GDP-top-counties.gif 531 × 311; 28 KB
-
 GDPgrowthrates1q2015.png 758 × 423; 63 KB
-
 General government net lending of Hungary 2005-2010.png 970 × 601; 18 KB
-
 GERD GDP ratio in East and Central Africa, 2013, or closest year.svg 315 × 295; 764 KB
-
 Growth rate of Indian GDP and employment.jpg 2,788 × 1,296; 731 KB
-
 HDP CZ.png 657 × 347; 4 KB
-
 Hu real gdp growth.svg 867 × 578; 7 KB
-
 InterestRGrowthDiff.PNG 959 × 593; 37 KB
-
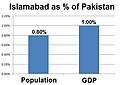 Islamabad Contribution to Pakistan.jpg 479 × 338; 21 KB
-
 Japan real GDP growth rate.png 979 × 601; 6 KB
-
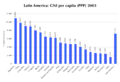
 LA-GDP-PPP.png 854 × 584; 16 KB
-
 LA-GNI-pc-PPP.png 854 × 584; 16 KB
-
 Lt real gdp growth.svg 867 × 723; 8 KB
-
 Lv real gdp growth.svg 1,084 × 867; 8 KB
-
 Nominal GDP IMF 2008 millions of USD.jpg 531 × 311; 27 KB
-
 OECD Productivity levels 2007.svg 1,600 × 939; 458 KB
-
 OECDWachst.PNG 970 × 604; 26 KB
-
 Per capita GDP of South Asian economies & SKorea (1950-1995).png 769 × 464; 38 KB
-
 Per capita GDP of South Asian economies & SKorea (1950-1995).svg 1,278 × 631; 143 KB
-
 Per capita GDP of South Asian economies.png 1,782 × 1,070; 393 KB
-
 Pib em dólares 1962-2014.jpg 1,524 × 630; 209 KB
-
 PIB España 2000-2009.png 512 × 396; 12 KB
-
 PIB par Etats et USA 2004-2006.svg 513 × 373; 89 KB
-
 PNB 2006-fr.svg 481 × 333; 66 KB
-
 PNB par habitants 2006.svg 480 × 335; 73 KB
-
 Polish GDP.PNG 444 × 238; 6 KB
-
 PPP GDP IMF 2008 millions of USD.jpg 479 × 286; 21 KB
-
 Pppgdp vers gdp in oecd en.svg 548 × 588; 39 KB
-
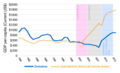
 Real GDP growth rates RS & FBH sr.png 1,031 × 608; 29 KB
-
 Real GDP growth rates RS & FBH.png 1,031 × 608; 30 KB
-
 Share of Global GDP.gif 538 × 460; 90 KB
-
 ShortIntRGrowthDiff.PNG 970 × 604; 37 KB
-
 Sw real gdp growth.svg 867 × 578; 8 KB
-
 Tcreceesp.jpg 1,871 × 985; 244 KB
-
 Top 20 BBP.PNG 650 × 575; 27 KB
-
 Top 20 GDP.png 650 × 562; 30 KB
-
 Top 25 GDP PPP ua.png 621 × 667; 29 KB
-
 Trends in GDP per capita and GDP growth in China, 2003–2014.svg 608 × 449; 231 KB
-
 United States GDP by States.png 697 × 962; 113 KB
-
 Uzbekistan GDPgrowth1992-2008 cropped.jpg 1,412 × 910; 163 KB
-
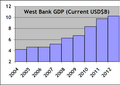 West BankGDP4.png 722 × 509; 15 KB
-
 World GDP Capita 1-2003 A.D.png 941 × 742; 13 KB
-
 Zim GDP per capita 1980-2010.svg 600 × 423; 105 KB
-
 Zimbabwe GDP per cap 2015.png 4,631 × 2,826; 654 KB
-
 ZinsWachsDiff.PNG 959 × 593; 21 KB
-
 Évolution PIB an 1 à 2003.jpg 1,026 × 727; 66 KB
-
 Évolution PIB par habitant an 1 à 2003.jpg 1,037 × 787; 53 KB


.png)
.svg)


