Category:Inflation graphs of the United States
Media in category "Inflation graphs of the United States"
The following 42 files are in this category, out of 42 total.
-
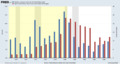
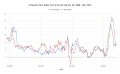
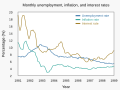 1981–1989 monthly unemployment, inflation, and interest rates.svg 1,000 × 750; 7 KB
-
 2021 Inflation.webp 838 × 839; 58 KB
-
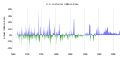
 Consumer Price Index US 1913-2004.png 1,996 × 1,228; 33 KB
-
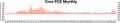 Core PCE Monthly.webp 4,522 × 878; 105 KB
-
 CPI GDP M2 and Velocity.png 850 × 575; 19 KB
-
 CPI vs M2 money supply increases.png 1,168 × 450; 60 KB
-
 Cpi-2010.svg 750 × 500; 15 KB
-
 Dollar value chart.png 453 × 277; 9 KB
-
 FRED graph US CPI for All Urban Consumers 1969–2019.png 1,168 × 470; 37 KB
-
 Fundamentals of Business - Fig. 2.7 - The United States Inflation Rate.jpg 2,086 × 1,670; 149 KB
-
 Infaltion usa.png 1,078 × 716; 50 KB
-
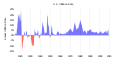
 Inflation and oil price 1969-1989 color corrected.png 1,168 × 620; 33 KB
-
 Inflation and oil.png 5,300 × 2,666; 455 KB
-
 Inflation compared to federal funds rate.jpg 1,444 × 784; 331 KB
-
 Inflation CPI vs. GDP deflator.jpg 960 × 720; 39 KB
-
 Inflation data.webp 3,925 × 1,725; 193 KB
-
 Inflation expectations.webp 1,432 × 496; 33 KB
-
 Inflation federal funds rate.png 5,104 × 2,675; 462 KB
-
 Inflation M2 CPI.webp 1,479 × 592; 53 KB
-
 InflationAndInterestRates.png 2,036 × 686; 61 KB
-
 M2 and Inflation USA.svg 662 × 481; 20 KB
-
 M2, CPI, PCE.webp 3,853 × 1,006; 118 KB
-
 M2andInflation.png 1,103 × 801; 71 KB
-
 Money Supply and Inflation.webp 1,482 × 611; 31 KB
-
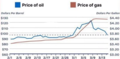 OilVsGasoline1Q22.png 534 × 262; 135 KB
-
 Piped natural gas prices United States.webp 4,502 × 1,153; 119 KB
-
 PPI monthly.webp 4,322 × 954; 73 KB
-
 Producer Price Index data chart.webp 3,726 × 1,172; 96 KB
-
 Producer Price Index Relative Importance.webp 4,968 × 3,888; 841 KB
-
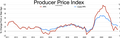
 Producer Price Index.svg 684 × 362; 89 KB
-
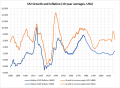
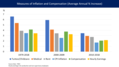 U.S. inflation and compensation measures - v1.png 1,394 × 783; 48 KB
-
 UK and US 1989-present monthly CPI.svg 1,132 × 700; 388 KB
-
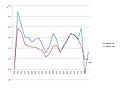
 United States GDP Inflation trend.png 979 × 601; 13 KB
-
 US Consumer Price Index Graph.svg 788 × 469; 105 KB
-

-
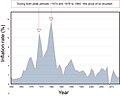
 US Historical Inflation Ancient.svg 821 × 400; 16 KB
-
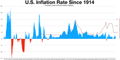
 US Historical Inflation.svg 800 × 400; 36 KB
-
 US inflation rate, expressed as YOY CPI, 1948 thru 2018.png 1,168 × 470; 76 KB
-
 US Inflation rate.png 918 × 452; 18 KB
-
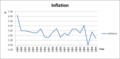
 US Inflation.png 1,200 × 800; 25 KB
-
 US producer price index 2005-2022.webp 1,556 × 398; 10 KB
-
 USACPI1800.svg 750 × 500; 14 KB


