Category:Maps from the Socioeconomic Data and Applications Center
Subcategories
This category has only the following subcategory.
E
- Environmental Performance Index (78 F)
Media in category "Maps from the Socioeconomic Data and Applications Center"
The following 200 files are in this category, out of 2,610 total.
(previous page) (next page)-
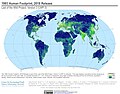 1993 Human Footprint, 2018 Release (48009062452).jpg 3,094 × 2,416; 1.54 MB
-
 1993 Human Footprint, 2018 Release Africa (48008981033).jpg 2,352 × 3,181; 1.63 MB
-
 1993 Human Footprint, 2018 Release Asia (48009062607).jpg 2,416 × 3,181; 1.96 MB
-
 1993 Human Footprint, 2018 Release Europe (48009062572).jpg 2,375 × 3,181; 2.19 MB
-
 1993 Human Footprint, 2018 Release North America (48008981098).jpg 2,419 × 3,181; 1.38 MB
-
 1993 Human Footprint, 2018 Release Oceania (48009062642).jpg 2,414 × 3,181; 745 KB
-
 1993 Human Footprint, 2018 Release South America (48008980908).jpg 2,406 × 3,181; 1.29 MB
-
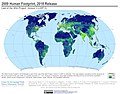 2009 Human Footprint, 2018 Release (48009015666).jpg 3,094 × 2,428; 1.53 MB
-
 2009 Human Footprint, 2018 Release Africa (48009103672).jpg 2,352 × 3,181; 1.6 MB
-
 2009 Human Footprint, 2018 Release Asia (48009015711).jpg 2,416 × 3,181; 1.98 MB
-
 2009 Human Footprint, 2018 Release Europe (48009015601).jpg 2,375 × 3,181; 2.26 MB
-
 2009 Human Footprint, 2018 Release North America (48009103577).jpg 2,419 × 3,181; 1.36 MB
-
 2009 Human Footprint, 2018 Release Oceania (48009015611).jpg 2,414 × 3,181; 750 KB
-
 2009 Human Footprint, 2018 Release South America (48009022418).jpg 2,359 × 3,181; 1.37 MB
-
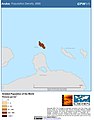
 Pitcairn Island (U.K.) Population Density, 2000 (5457017501).jpg 2,507 × 3,265; 592 KB
-
 Pitcairn Population Density, 2000 (6171916123).jpg 2,324 × 3,161; 488 KB
-
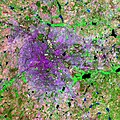 A satellite image of Bangalore, India (2011).jpg 1,000 × 1,000; 225 KB
-
 Abu Dhabi Percent Change of Chlorophyll-a Concentration, 1998-2007 (50516062393).jpg 2,217 × 3,164; 545 KB
-
 Accra, Ghana (5460920783).jpg 1,000 × 1,000; 162 KB
-

-
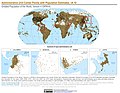 Administrative Unit Center Points with Population Estimates, v4.10 (40009449582).jpg 3,107 × 2,413; 1.25 MB
-
 Administrative Unit Center Points with Population Estimates, v4.11 (48009036428).jpg 3,108 × 2,413; 1.25 MB
-
 Afghanistan Input Administrative Boundaries (5457147009).jpg 2,550 × 3,209; 738 KB
-
 Afghanistan Population Density, 2000 (5457009605).jpg 2,524 × 3,265; 663 KB
-
 Afghanistan Population Density, 2000 (6172431218).jpg 2,380 × 3,160; 675 KB
-
 Afghanistan Settlement Points (6172872338).jpg 2,391 × 3,189; 695 KB
-
 Afghanistan Urban Extents (6172027339).jpg 2,408 × 3,189; 666 KB
-

-

-

-

-
 Africa 100 km and 200 km Coastal Zones (5485511123).jpg 2,403 × 3,174; 872 KB
-
 Africa Amphibian Species Richness Map (5458000124).jpg 2,470 × 3,174; 563 KB
-
 Africa Anthropogenic Biomes, version 1 (5457216894).jpg 2,470 × 3,174; 1.16 MB
-
 Africa Biomes (5485510655).jpg 2,415 × 3,174; 825 KB
-
 Africa Child Malnutrition (5458099644).jpg 2,150 × 3,155; 671 KB
-
 Africa Climate Zones (5485510795).jpg 2,407 × 3,174; 768 KB
-
 Africa Elevation Zones (5486106280).jpg 2,386 × 3,174; 776 KB
-

-

-
 Africa Hunger Density (5458099740).jpg 2,150 × 3,155; 688 KB
-
 Africa Infant Mortality Rates -IMR- (5457445133).jpg 2,166 × 3,155; 660 KB
-
 Africa Input Administrative Boundaries (5457147061).jpg 2,525 × 3,209; 918 KB
-
 Africa Percent Change of Chlorophyll-a Concentration, 1998-2007 (5457272587).jpg 2,217 × 3,164; 657 KB
-
 Africa Population Density (5485511427).jpg 2,386 × 3,174; 788 KB
-
 Africa Population Density overlaid by urban spatial extents, 2000 (5457009645).jpg 2,522 × 3,191; 806 KB
-
 Africa Population Density, 2000 (6172431358).jpg 2,399 × 3,160; 802 KB
-
 Africa Settlement Points (6172343959).jpg 2,368 × 3,189; 1.29 MB
-
 Africa The Human Footprint Index, version 2 (5457426899).jpg 2,456 × 3,174; 1.25 MB
-
 Africa The Human Influence Index, version 2 (5457431785).jpg 2,470 × 3,174; 988 KB
-
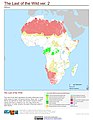 Africa The Last of the Wild, version 2 (5458041600).jpg 2,470 × 3,174; 821 KB
-
 Africa Urban Extents (6172027435).jpg 2,334 × 3,189; 901 KB
-
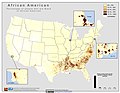 African American (5457402563).jpg 3,273 × 2,542; 1.04 MB
-

-

-
 Agricultural Subsidies (5457257716).jpg 3,170 × 2,354; 669 KB
-
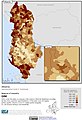
 Albania Headcount Index (5457360835).jpg 2,137 × 3,155; 563 KB
-
 Albania Headcount Index, First Tier Cities (5457361037).jpg 2,163 × 3,168; 631 KB
-
 Albania Inequality (Generalized Entropy Measure, Parameter 0) (5457967782).jpg 2,133 × 3,155; 653 KB
-
 Albania Inequality (Generalized Entropy Measure, Parameter 1) (5457360975).jpg 2,149 × 3,155; 640 KB
-
 Albania Inequality (GINI) (5457361017).jpg 2,172 × 3,155; 581 KB
-
 Albania Inequality (GINI), First Tier Cities (5457361205).jpg 2,167 × 3,168; 645 KB
-

-

-
 Albania Input Administrative Boundaries (5457147201).jpg 2,524 × 3,209; 623 KB
-
 Albania Population Density, 2000 (5457616736).jpg 2,518 × 3,264; 650 KB
-
 Albania Population Density, 2000 (6171902327).jpg 2,335 × 3,160; 629 KB
-
 Albania Poverty Gap Index (5457967718).jpg 2,149 × 3,151; 614 KB
-
 Albania Poverty Gap Index, First Tier Cities (5457361087).jpg 2,167 × 3,168; 686 KB
-
 Albania Settlement Points (6172872588).jpg 2,353 × 3,188; 665 KB
-
 Albania Squared Poverty Gap Index (5457360901).jpg 2,144 × 3,150; 611 KB
-
 Albania Urban Extents (6172556498).jpg 2,364 × 3,189; 663 KB
-
 Algeria Input Administrative Boundaries (5457755778).jpg 2,525 × 3,209; 630 KB
-
 Algeria Population Density, 2000 (5457012213).jpg 2,550 × 3,198; 609 KB
-
 Algeria Population Density, 2000 (6172436556).jpg 2,346 × 3,160; 619 KB
-
 Algeria Settlement Points (6172347575).jpg 2,325 × 3,188; 763 KB
-
 Algeria Urban Extents (6172033337).jpg 2,336 × 3,189; 694 KB
-
 Altimeter Corrected Elevations (ACE2), (1994–2005) (48980372126).jpg 3,109 × 2,428; 1.3 MB
-
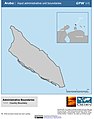
 America Samoa Input Administrative Boundaries (5457763764).jpg 2,524 × 3,209; 565 KB
-
 American Indian and Alaska Native (5457402603).jpg 3,246 × 2,485; 902 KB
-
 American Samoa Input Administrative Boundaries (5457147463).jpg 2,524 × 3,209; 544 KB
-
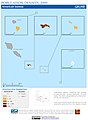
 American Samoa Population Density, 2000 (5457617164).jpg 2,481 × 3,169; 544 KB
-
 American Samoa Population Density, 2000 (6172432298).jpg 2,324 × 3,161; 565 KB
-
 American Samoa Settlement Points (6172344567).jpg 2,313 × 3,189; 596 KB
-
 American Samoa Urban Extents (6172028575).jpg 2,336 × 3,189; 585 KB
-
 Americas Bird Species Richness Map (5457385535).jpg 2,388 × 3,174; 580 KB
-
 Americas Mammal Species Richness Map (5457996280).jpg 2,388 × 3,174; 578 KB
-
 Amman, Jordan (5461524154).jpg 1,000 × 1,000; 279 KB
-
 Andorra Input Administrative Boundaries (5457753410).jpg 2,524 × 3,209; 565 KB
-
 Andorra Population Density, 2000 (5457616860).jpg 2,502 × 3,265; 557 KB
-
 Andorra Population Density, 2000 (6171902441).jpg 2,335 × 3,161; 547 KB
-
 Andorra Settlement Points (6172872662).jpg 2,373 × 3,188; 579 KB
-
 Andorra Urban Extents (6172556658).jpg 2,384 × 3,189; 564 KB
-
 Angola Input Administrative Boundaries (5457147111).jpg 2,525 × 3,209; 612 KB
-
 Angola Population Density, 2000 (5457009693).jpg 2,528 × 3,272; 609 KB
-
 Angola Population Density, 2000 (6172431452).jpg 2,322 × 3,160; 582 KB
-
 Angola Settlement Points (6172344011).jpg 2,309 × 3,189; 621 KB
-
 Angola Urban Extents (6172027515).jpg 2,336 × 3,189; 616 KB
-
 Anguilla (U.K.) Population Density, 2000 (5457009737).jpg 2,505 × 3,194; 565 KB
-
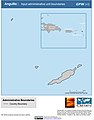 Anguilla Input Administrative Boundaries (5457753326).jpg 2,524 × 3,209; 564 KB
-
 Anguilla Population Density, 2000 (6171902247).jpg 2,324 × 3,161; 501 KB
-
 Anguilla Settlement Points (6172872528).jpg 2,311 × 3,188; 560 KB
-
 Anguilla Urban Extents (6172027605).jpg 2,336 × 3,189; 543 KB
-
 Anthropogenic Biomes of the World, Version 2, 1700 Africa (13603045793).jpg 2,350 × 3,161; 970 KB
-
 Anthropogenic Biomes of the World, Version 2, 1700 Asia (13603030405).jpg 2,350 × 3,161; 1.28 MB
-
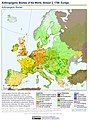 Anthropogenic Biomes of the World, Version 2, 1700 Europe (13603392004).jpg 2,350 × 3,161; 1.32 MB
-
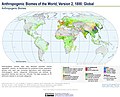
 Anthropogenic Biomes of the World, Version 2, 1700 Global (13603029325).jpg 3,044 × 2,450; 1.02 MB
-
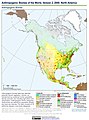
 Anthropogenic Biomes of the World, Version 2, 1700 North America (13603391594).jpg 2,358 × 3,171; 923 KB
-
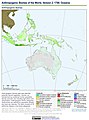 Anthropogenic Biomes of the World, Version 2, 1700 Oceania (13603044193).jpg 2,350 × 3,171; 833 KB
-
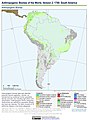 Anthropogenic Biomes of the World, Version 2, 1700 South America (13603393314).jpg 2,350 × 3,171; 821 KB
-
 Anthropogenic Biomes of the World, Version 2, 1800 Africa (13603346673).jpg 2,350 × 3,161; 981 KB
-
 Anthropogenic Biomes of the World, Version 2, 1800 Asia (13603692374).jpg 2,350 × 3,161; 1.4 MB
-
 Anthropogenic Biomes of the World, Version 2, 1800 Europe (13603333335).jpg 2,350 × 3,161; 1.46 MB
-
 Anthropogenic Biomes of the World, Version 2, 1800 Global (13603332645).jpg 3,044 × 2,450; 1.04 MB
-
 Anthropogenic Biomes of the World, Version 2, 1800 North America (13603346783).jpg 2,350 × 3,171; 927 KB
-
 Anthropogenic Biomes of the World, Version 2, 1800 Oceania (13603332235).jpg 2,350 × 3,157; 832 KB
-
 Anthropogenic Biomes of the World, Version 2, 1800 South America (13603349153).jpg 2,350 × 3,171; 818 KB
-
 Anthropogenic Biomes of the World, Version 2, 1900 Africa (13603728423).jpg 2,350 × 3,161; 1.02 MB
-
 Anthropogenic Biomes of the World, Version 2, 1900 Asia (13603715275).jpg 2,351 × 3,161; 1.6 MB
-
 Anthropogenic Biomes of the World, Version 2, 1900 Europe (13604072224).jpg 2,353 × 3,161; 1.64 MB
-
 Anthropogenic Biomes of the World, Version 2, 1900 Global (13603726573).jpg 3,044 × 2,450; 1.13 MB
-
 Anthropogenic Biomes of the World, Version 2, 1900 North America (13604071504).jpg 2,350 × 3,171; 1.05 MB
-
 Anthropogenic Biomes of the World, Version 2, 1900 Oceania (13603713635).jpg 2,350 × 3,157; 917 KB
-
 Anthropogenic Biomes of the World, Version 2, 1900 South America (13603717025).jpg 2,351 × 3,171; 937 KB
-
 Anthropogenic Biomes of the World, Version 2, 2000 Africa (13604310084).jpg 2,357 × 3,161; 1.33 MB
-
 Anthropogenic Biomes of the World, Version 2, 2000 Asia (13603964153).jpg 2,351 × 3,161; 1.8 MB
-
 Anthropogenic Biomes of the World, Version 2, 2000 Europe (13604307884).jpg 2,350 × 3,161; 1.88 MB
-
 Anthropogenic Biomes of the World, Version 2, 2000 Global (13603947015).jpg 3,044 × 2,450; 1.28 MB
-
 Anthropogenic Biomes of the World, Version 2, 2000 North America (13603946895).jpg 2,350 × 3,171; 1.16 MB
-
 Anthropogenic Biomes of the World, Version 2, 2000 Oceania (13603961633).jpg 2,350 × 3,157; 938 KB
-
 Anthropogenic Biomes of the World, Version 2, 2000 South America (13604310194).jpg 2,350 × 3,171; 1.08 MB
-
 Antigua and Barbuda Input Administrative Boundaries (5457147487).jpg 2,524 × 3,209; 583 KB
-
 Antigua and Barbuda Population Density, 2000 (5457617204).jpg 2,507 × 3,194; 570 KB
-
 Antigua and Barbuda Population Density, 2000 (6171902509).jpg 2,324 × 3,161; 507 KB
-
 Antigua and Barbuda Population Density, 2000 (6171903097).jpg 2,401 × 3,161; 550 KB
-
 Antigua and Barbuda Settlement Points (6172344247).jpg 2,381 × 3,188; 678 KB
-
 Antigua and Barbuda Settlement Points (6172344617).jpg 2,311 × 3,188; 581 KB
-
 Antigua and Barbuda Urban Extents (6172028059).jpg 2,406 × 3,189; 668 KB
-
 Antigua and Barbuda Urban Extents (6172557336).jpg 2,336 × 3,189; 562 KB
-
 Argentian Population Density, 2000 (5457617020).jpg 2,507 × 3,262; 684 KB
-
 Argentina Input Administrative Boundaries (5457147341).jpg 2,525 × 3,209; 730 KB
-
 Argentina Population Density, 2000 (6172432038).jpg 2,324 × 3,161; 612 KB
-
 Argentina Settlement Points (6172872836).jpg 2,326 × 3,188; 884 KB
-
 Argentina Urban Extents (6172028233).jpg 2,324 × 3,189; 696 KB
-
 Armenia Input Administrative Boundaries (5457753574).jpg 2,524 × 3,209; 608 KB
-
 Armenia Population Density, 2000 (5457617066).jpg 2,507 × 3,264; 624 KB
-
 Armenia Population Density, 2000 (6171902839).jpg 2,366 × 3,160; 598 KB
-
 Armenia Settlement Points (6172872904).jpg 2,393 × 3,188; 639 KB
-
 Armenia Urban Extents (6172028317).jpg 2,408 × 3,189; 636 KB
-
 Aruba Input Administrative Boundaries (5457752798).jpg 2,525 × 3,209; 572 KB
-
 Aruba Population Density, 2000 (5457009561).jpg 2,497 × 3,194; 561 KB
-
 Aruba Population Density, 2000 (6171901723).jpg 2,324 × 3,161; 507 KB
-
 Aruba Settlement Points (6171990533).jpg 2,311 × 3,188; 555 KB
-
 Aruba Urban Extents (6172027227).jpg 2,336 × 3,189; 541 KB
-

-

-

-

-
 Asia 100 km and 200 km Coastal Zones (5485511943).jpg 2,403 × 3,174; 1,017 KB
-
 Asia Amphibian Species Richness Map (5458000154).jpg 2,470 × 3,174; 654 KB
-
 Asia and Russia Input Administrative Boundaries (recheck) (5457147429).jpg 2,524 × 3,209; 1.07 MB
-
 Asia Anthropogenic Biomes, version 1 (5456610763).jpg 2,470 × 3,174; 1.42 MB
-
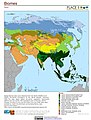 Asia Biomes (5485511547).jpg 2,415 × 3,174; 1,004 KB
-
 Asia Child Malnutrition (5458099776).jpg 2,216 × 3,147; 729 KB
-
 Asia Climate Zones (5486106698).jpg 2,407 × 3,174; 1.07 MB
-
 Asia Elevation Zones (5485512129).jpg 2,390 × 3,174; 1,007 KB
-

-

-
 Asia Infant Mortality Rate, Asia -IMR- (5458051832).jpg 2,210 × 3,155; 747 KB
-
 Asia Population Density (5486107146).jpg 2,386 × 3,174; 932 KB
-
 Asia Population Density, 2000 (5457010133).jpg 2,550 × 3,166; 968 KB
-
 Asia Population Density, 2000 (6172432250).jpg 2,399 × 3,160; 928 KB
-
 Asia Settlement Points (6172873014).jpg 2,444 × 3,189; 1.38 MB
-
 Asia The Human Footprint Index, version 2 (5457426959).jpg 2,452 × 3,174; 1.7 MB
-
 Asia The Human Influence Index, version 2 (5457431847).jpg 2,470 × 3,174; 1.32 MB
-
 Asia The Last of the Wild, version 2 (5457435041).jpg 2,468 × 3,174; 1,015 KB
-
 Asia Urban Extents (6172028457).jpg 2,334 × 3,189; 1.02 MB
-
 Athens, Greece (5461524194).jpg 1,000 × 1,000; 281 KB
-
 Atlanta, Georgia, United States (5461524218).jpg 1,000 × 1,000; 259 KB
-
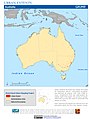
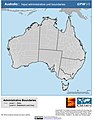 Australia Input Administrative Boundaries (5457147527).jpg 2,524 × 3,209; 730 KB
-
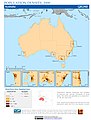
 Australia Percent Change of Chlorophyll-a Concentration, 1998-2007 (5457272627).jpg 2,217 × 3,164; 607 KB
-
 Australia Population Density, 2000 (5457617258).jpg 2,550 × 3,264; 699 KB
-
 Australia Population Density, 2000 (6171903217) (cropped).jpg 2,401 × 2,882; 612 KB
-
 Australia Population Density, 2000 (6171903217).jpg 2,401 × 3,161; 712 KB
-
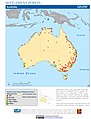 Australia Settlement Points (6172873182).jpg 2,429 × 3,189; 759 KB
-
 Australia Urban Extents (6172028795).jpg 2,408 × 3,189; 715 KB
-
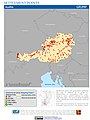
 Austria Input Administrative Boundaries (5457147557).jpg 2,550 × 3,209; 675 KB
-
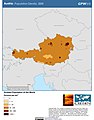 Austria Population Density, 2000 (5457617298).jpg 2,550 × 3,265; 641 KB
-
 Austria Population Density, 2000 (6172432546).jpg 2,401 × 3,161; 646 KB
-
 Austria Settlement Points (6172344749).jpg 2,401 × 3,188; 749 KB
-
 Austria Urban Extents (6172557612).jpg 2,412 × 3,189; 718 KB
-
 Azerbaijan Input Administrative Boundaries (5457147595).jpg 2,550 × 3,209; 731 KB
-
 Azerbaijan Population Density, 2000 (5457617338).jpg 2,550 × 3,260; 646 KB
-
 Azerbaijan Population Density, 2000 (6171903391).jpg 2,367 × 3,160; 704 KB
-
 Azerbaijan Settlement Points (6172344845).jpg 2,339 × 3,188; 723 KB
-
 Azerbaijan Urban Extents (6172029077).jpg 2,354 × 3,189; 738 KB
-
 Bahamas Input Administrative Boundaries (5457754174).jpg 2,524 × 3,209; 641 KB
-
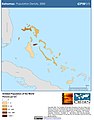 Bahamas Population Density, 2000 (5457617680).jpg 2,508 × 3,194; 620 KB
-
 Bahamas Population Density, 2000 (6172433392).jpg 2,401 × 3,161; 603 KB
-
 Bahamas Settlement Points (6172873826).jpg 2,379 × 3,188; 686 KB
.jpg)
.jpg)
.jpg)
.jpg)
.jpg)
.jpg)
.jpg)
.jpg)
.jpg)
.jpg)
.jpg)
.jpg)
.jpg)
.jpg)
_Population_Density,_2000_(5457017501).jpg)
.jpg)
.jpg)
.jpg)
.jpg)
.jpg)
.jpg)
.jpg)
.jpg)
.jpg)
.jpg)
.jpg)
.jpg)
.jpg)
.jpg)
_Dams,_Revision_01_(6185231337).jpg)
_Reservoirs,_Revision_01_(6185245117).jpg)
.jpg)
.jpg)
.jpg)
.jpg)
.jpg)
.jpg)
.jpg)
.jpg)
.jpg)
.jpg)
.jpg)
.jpg)
.jpg)
.jpg)
.jpg)
.jpg)
.jpg)
.jpg)
.jpg)
.jpg)
.jpg)
.jpg)
_Hazardous_Waste_Site_Polygon_Data_with_CIESIN_Modifications,_Version_2_National_Priority_List_Superfund_Sites_(17247804505).jpg)
_Hazardous_Waste_Site_Polygon_Data,_Version_2_(16627595593).jpg)
.jpg)
.jpg)
.jpg)
_(5457967782).jpg)
_(5457360975).jpg)
_(5457361017).jpg)
,_First_Tier_Cities_(5457361205).jpg)
_(5457361125).jpg)
_(5457967944).jpg)
.jpg)
.jpg)
.jpg)
.jpg)
.jpg)
.jpg)
.jpg)
.jpg)
.jpg)
.jpg)
.jpg)
.jpg)
.jpg)
,_(1994%E2%80%932005)_(48980372126).jpg)
.jpg)
.jpg)
.jpg)
.jpg)
.jpg)
.jpg)
.jpg)
.jpg)
.jpg)
.jpg)
.jpg)
.jpg)
.jpg)
.jpg)
.jpg)
.jpg)
.jpg)
.jpg)
.jpg)
.jpg)
_Population_Density,_2000_(5457009737).jpg)
.jpg)
.jpg)
.jpg)
.jpg)
.jpg)
.jpg)
.jpg)
.jpg)
.jpg)
.jpg)
.jpg)
.jpg)
.jpg)
.jpg)
.jpg)
.jpg)
.jpg)
.jpg)
.jpg)
.jpg)
.jpg)
.jpg)
.jpg)
.jpg)
.jpg)
.jpg)
.jpg)
.jpg)
.jpg)
.jpg)
.jpg)
.jpg)
.jpg)
.jpg)
.jpg)
.jpg)
.jpg)
.jpg)
.jpg)
.jpg)
.jpg)
.jpg)
.jpg)
.jpg)
.jpg)
.jpg)
.jpg)
.jpg)
.jpg)
.jpg)
.jpg)
.jpg)
.jpg)
.jpg)
.jpg)
.jpg)
.jpg)
_Dams,_Revision_01_(6185754266).jpg)
_Reservoirs,_Revision_01_(6185245305).jpg)
.jpg)
.jpg)
_(5457147429).jpg)
.jpg)
.jpg)
.jpg)
.jpg)
.jpg)
.jpg)
.jpg)
.jpg)
.jpg)
.jpg)
.jpg)
.jpg)
.jpg)
.jpg)
.jpg)
.jpg)
.jpg)
.jpg)
.jpg)
.jpg)
.jpg)
_(cropped).jpg)
.jpg)
.jpg)
.jpg)
.jpg)
.jpg)
.jpg)
.jpg)
.jpg)
.jpg)
.jpg)
.jpg)
.jpg)
.jpg)
.jpg)
.jpg)
.jpg)
.jpg)