Category:Maps showing African American history
Media in category "Maps showing African American history"
The following 66 files are in this category, out of 66 total.
-
-
 Abolition of slavery in the United States SVG map.svg 942 × 595; 183 KB
-
 African American (5457402563).jpg 3,273 × 2,542; 1.04 MB
-
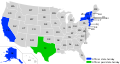
 African Americans by state.svg 1,199 × 593; 72 KB
-
 African Americans in the United States Senate (2023).png 2,560 × 1,583; 299 KB
-
 African Americans in the United States Senate.svg 959 × 593; 35 KB
-
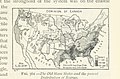
 AfricanAmericanCivlWarMap1.jpg 494 × 293; 58 KB
-
 Agriculture US South 1860.jpg 802 × 582; 229 KB
-
 Black % by U.S. state 1900.svg 749 × 527; 168 KB
-
 Black chicago1.png 500 × 375; 31 KB
-
 BlackPopulation.png 1,350 × 625; 42 KB
-
 Buffalo soldiers map 1860-1900.jpg 2,750 × 1,886; 770 KB
-
 Census 1900 Percent Black.png 5,263 × 3,477; 1.98 MB
-
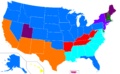
 Census-2000-Data-Top-US-Ancestries-by-County.jpg 3,766 × 2,820; 1.28 MB
-
 Census2000 Percent Black Map.jpg 932 × 690; 517 KB
-
 CSA states evolution.gif 1,000 × 677; 245 KB
-
 Educational separation in the US prior to Brown Map.png 600 × 400; 19 KB
-
 Emancipation Proclamation.PNG 1,513 × 983; 54 KB
-
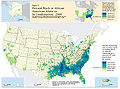
 GreatMigration1910to1970-UrbanPopulation.png 880 × 508; 101 KB
-
 Greats Migration african american's in USA 1910-1970.png 2,048 × 1,150; 744 KB
-
 Gullah1.PNG 800 × 524; 518 KB
-
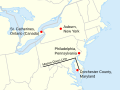
 Harriet Tubman Locations Map.jpg 446 × 383; 98 KB
-
 Harriet Tubmap Location Map.svg 720 × 540; 857 KB
-
 Image-Census-2000-Data-Top-US-Ancestries-by-County fr FR.png 3,766 × 2,820; 837 KB
-
 Little Liberia (Bridgeport, Connecticut) 1850.png 1,167 × 1,265; 926 KB
-
 Map-usa-juneteenth.svg 1,114 × 595; 126 KB
-
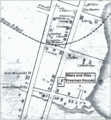 Mary and Eliza Freeman Houses map 1850.png 1,167 × 1,265; 917 KB
-
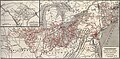
 Mville 1864map.jpg 800 × 510; 168 KB
-
 New 2000 black density.gif 2,604 × 2,012; 620 KB
-
 New 2000 black percent.gif 2,604 × 2,012; 649 KB
-
 OldFourthWardInEastCentralAtlanta.jpg 535 × 573; 192 KB
-
 Plurality Black counties.png 1,513 × 983; 169 KB
-
 Reynolds's Political Map of the United States 1856.jpg 7,813 × 7,090; 19.76 MB
-
 Slave and Free States before the American Civil War 2.svg 651 × 404; 110 KB
-
 Slave and Free States before the American Civil War-unbiased.png 800 × 502; 83 KB
-
 Slave and Free States before the American Civil War.svg 882 × 553; 105 KB
-
 Slave population.JPG 432 × 346; 45 KB
-
 Slavery in the 13 colonies-ar.jpg 550 × 611; 119 KB
-
 Slavery in the 13 colonies.jpg 550 × 611; 109 KB
-
 Slavery US 1820.png 600 × 790; 200 KB
-
 United States Slavery Map 1860.jpg 1,903 × 1,146; 455 KB
-
 Southern counties with 40 percent African-American population in 2000.png 1,513 × 983; 173 KB
-
 Southernsegregationdejure1.gif 546 × 378; 7 KB
-
 The Negro in Chicago; a study of race relations and a race riot (1922) (14598147737).jpg 1,698 × 3,482; 1.18 MB
-
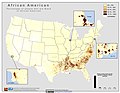
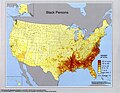
 U.S. Distribution of African Americans, Percentage by County, 2010.png 690 × 484; 135 KB
-
 Undergroundrailroadsmall2.jpg 1,035 × 600; 274 KB
-
 United States 1860-1870.gif 787 × 483; 49 KB
-
 US Census 1990 black.jpg 1,280 × 997; 1.18 MB
-
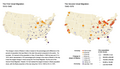
 US Slave Free 1789-1861-de.gif 774 × 468; 111 KB
-
 US Slave Free 1789-1861.gif 774 × 468; 100 KB
-
 US SlaveFree1789.gif 774 × 468; 20 KB
-
 US SlaveFree1800.gif 774 × 468; 22 KB
-
 US SlaveFree1821.gif 774 × 468; 24 KB
-
 US SlaveFree1837.gif 774 × 468; 24 KB
-
 US SlaveFree1846 2.gif 774 × 468; 22 KB
-
 US SlaveFree1846 Wilmot.gif 774 × 468; 26 KB
-
 US SlaveFree1858.gif 774 × 468; 25 KB
-
 US SlaveFree1860.gif 774 × 468; 25 KB
-
 USA 2000 Black Density.PNG 762 × 494; 685 KB
-
 USA 2000 black density.png 1,130 × 716; 135 KB
-
 USA-2000-black-density.gif 901 × 590; 53 KB
-
 USMapCommonAncestry2000.PNG 2,000 × 1,237; 286 KB
-
 Vereinigte Staaten 1837 freie und Sklavenstaaten.png 1,000 × 627; 82 KB
-
 Virginia Ancestries by County no text.svg 666 × 307; 145 KB
-
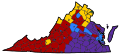
 Virginia Ancestries by County.jpg 511 × 384; 107 KB
-
 Virginia Ancestries by County.svg 666 × 460; 132 KB
.jpg)

.jpg)

.png)


_1850.png)


_(14598147737).jpg)


