Category:MathCad diagrams
Media in category "MathCad diagrams"
The following 22 files are in this category, out of 22 total.
-
 3D-plot.png 355 × 318; 19 KB
-
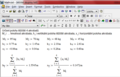 Akrobati, Lokální těžiště a hmotnosti 3 výpočet sw Mathcad.png 598 × 382; 121 KB
-
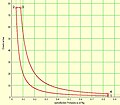 Diesel-Prozess im p-v-Diagram.jpg 590 × 515; 52 KB
-
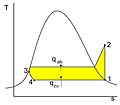
 Dieselprozess im T-s-Diagramm.jpg 520 × 574; 58 KB
-
 Hi2.png 182 × 140; 2 KB
-
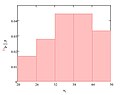 Histogram of relative frequencies.jpg 1,307 × 1,031; 78 KB
-
 Hoorn003.png 300 × 269; 135 KB
-
 Horn002.png 300 × 253; 72 KB
-
 Kaltdampfproz T-s-Dia.jpg 1,171 × 1,028; 67 KB
-
 Kaltdampfprozess T-s-Diagramm.svg 400 × 287; 11 KB
-
 Paradoxo de Zenão.PNG 450 × 350; 7 KB
-
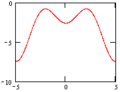
 Partial derivative function.png 712 × 716; 123 KB
-
 Pythagorean graphic.svg 201 × 200; 3 KB
-
 Surface-plot.png 495 × 478; 55 KB
-
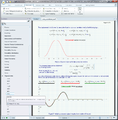 Top right Prime screengrab.png 1,021 × 1,036; 298 KB
-
 Victoria Crater 3D 03.png 962 × 1,019; 1.58 MB
-
 Volumenänderungsarbeit.jpg 744 × 1,092; 147 KB
-
 Xyz mathcad code.png 1,158 × 648; 59 KB
-
 Xyz mathcad.png 600 × 419; 32 KB
-
 Zeno Paradox de.PNG 450 × 350; 7 KB
-
 Zeno Paradox.PNG 450 × 350; 7 KB
-
 Zeno Paradox.svg 450 × 350; 69 KB


