Category:NCEP weather maps for August 2008
Media in category "NCEP weather maps for August 2008"
The following 155 files are in this category, out of 155 total.
-
 2008-08-01 24-hr Precipitation Map NOAA.png 1,000 × 710; 46 KB
-
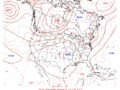
 2008-08-01 500-Millibar Height Contour Map NOAA.png 1,039 × 779; 69 KB
-
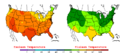
 2008-08-01 Color Max-min Temperature Map NOAA.png 800 × 350; 21 KB
-
 2008-08-01 Max-min Temperature Map NOAA.png 1,000 × 710; 50 KB
-
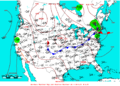
 2008-08-01 Surface Weather Map NOAA.png 1,088 × 783; 45 KB
-
 2008-08-02 24-hr Precipitation Map NOAA.png 1,000 × 710; 46 KB
-
 2008-08-02 500-Millibar Height Contour Map NOAA.png 1,039 × 779; 70 KB
-
 2008-08-02 Color Max-min Temperature Map NOAA.png 800 × 350; 21 KB
-
 2008-08-02 Max-min Temperature Map NOAA.png 1,000 × 710; 50 KB
-
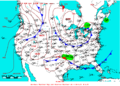
 2008-08-02 Surface Weather Map NOAA.png 1,088 × 783; 46 KB
-
 2008-08-03 24-hr Precipitation Map NOAA.png 1,000 × 710; 47 KB
-
 2008-08-03 500-Millibar Height Contour Map NOAA.png 1,039 × 779; 71 KB
-
 2008-08-03 Color Max-min Temperature Map NOAA.png 800 × 350; 22 KB
-
 2008-08-03 Max-min Temperature Map NOAA.png 1,000 × 710; 50 KB
-
 2008-08-03 Surface Weather Map NOAA.png 1,088 × 783; 49 KB
-
 2008-08-04 24-hr Precipitation Map NOAA.png 1,000 × 710; 47 KB
-
 2008-08-04 500-Millibar Height Contour Map NOAA.png 1,039 × 779; 70 KB
-
 2008-08-04 Color Max-min Temperature Map NOAA.png 800 × 350; 22 KB
-
 2008-08-04 Max-min Temperature Map NOAA.png 1,000 × 710; 50 KB
-
 2008-08-04 Surface Weather Map NOAA.png 1,088 × 783; 48 KB
-
 2008-08-05 24-hr Precipitation Map NOAA.png 1,000 × 710; 46 KB
-
 2008-08-05 500-Millibar Height Contour Map NOAA.png 1,039 × 779; 72 KB
-
 2008-08-05 Color Max-min Temperature Map NOAA.png 800 × 350; 21 KB
-
 2008-08-05 Max-min Temperature Map NOAA.png 1,000 × 710; 50 KB
-
 2008-08-05 Surface Weather Map NOAA.png 1,088 × 783; 47 KB
-
 2008-08-06 24-hr Precipitation Map NOAA.png 1,000 × 710; 48 KB
-
 2008-08-06 500-Millibar Height Contour Map NOAA.png 1,039 × 779; 71 KB
-
 2008-08-06 Color Max-min Temperature Map NOAA.png 800 × 350; 21 KB
-
 2008-08-06 Max-min Temperature Map NOAA.png 1,000 × 710; 50 KB
-
 2008-08-06 Surface Weather Map NOAA.png 1,088 × 783; 45 KB
-
 2008-08-07 24-hr Precipitation Map NOAA.png 1,000 × 710; 48 KB
-
 2008-08-07 500-Millibar Height Contour Map NOAA.png 1,039 × 779; 73 KB
-
 2008-08-07 Color Max-min Temperature Map NOAA.png 800 × 350; 21 KB
-
 2008-08-07 Max-min Temperature Map NOAA.png 1,000 × 710; 50 KB
-
 2008-08-07 Surface Weather Map NOAA.png 1,088 × 783; 46 KB
-
 2008-08-08 24-hr Precipitation Map NOAA.png 1,000 × 710; 48 KB
-
 2008-08-08 500-Millibar Height Contour Map NOAA.png 1,039 × 779; 75 KB
-
 2008-08-08 Color Max-min Temperature Map NOAA.png 800 × 350; 22 KB
-
 2008-08-08 Max-min Temperature Map NOAA.png 1,000 × 710; 50 KB
-
 2008-08-08 Surface Weather Map NOAA.png 1,088 × 783; 45 KB
-
 2008-08-09 24-hr Precipitation Map NOAA.png 1,000 × 710; 48 KB
-
 2008-08-09 500-Millibar Height Contour Map NOAA.png 1,039 × 779; 75 KB
-
 2008-08-09 Color Max-min Temperature Map NOAA.png 800 × 350; 22 KB
-
 2008-08-09 Max-min Temperature Map NOAA.png 1,000 × 710; 50 KB
-
 2008-08-09 Surface Weather Map NOAA.png 1,088 × 783; 47 KB
-
 2008-08-10 24-hr Precipitation Map NOAA.png 1,000 × 710; 47 KB
-
 2008-08-10 500-Millibar Height Contour Map NOAA.png 1,039 × 779; 72 KB
-
 2008-08-10 Color Max-min Temperature Map NOAA.png 800 × 350; 22 KB
-
 2008-08-10 Max-min Temperature Map NOAA.png 1,000 × 710; 50 KB
-
 2008-08-10 Surface Weather Map NOAA.png 1,088 × 783; 46 KB
-
 2008-08-11 24-hr Precipitation Map NOAA.png 1,000 × 710; 47 KB
-
 2008-08-11 500-Millibar Height Contour Map NOAA.png 1,039 × 779; 73 KB
-
 2008-08-11 Color Max-min Temperature Map NOAA.png 800 × 350; 22 KB
-
 2008-08-11 Max-min Temperature Map NOAA.png 1,000 × 710; 50 KB
-
 2008-08-11 Surface Weather Map NOAA.png 1,088 × 783; 48 KB
-
 2008-08-12 24-hr Precipitation Map NOAA.png 1,000 × 710; 46 KB
-
 2008-08-12 500-Millibar Height Contour Map NOAA.png 1,039 × 779; 73 KB
-
 2008-08-12 Color Max-min Temperature Map NOAA.png 800 × 350; 21 KB
-
 2008-08-12 Max-min Temperature Map NOAA.png 1,000 × 710; 50 KB
-
 2008-08-12 Surface Weather Map NOAA.png 1,088 × 783; 47 KB
-
 2008-08-13 24-hr Precipitation Map NOAA.png 1,000 × 710; 47 KB
-
 2008-08-13 500-Millibar Height Contour Map NOAA.png 1,039 × 779; 72 KB
-
 2008-08-13 Color Max-min Temperature Map NOAA.png 800 × 350; 21 KB
-
 2008-08-13 Max-min Temperature Map NOAA.png 1,000 × 710; 50 KB
-
 2008-08-13 Surface Weather Map NOAA.png 1,088 × 783; 46 KB
-
 2008-08-14 24-hr Precipitation Map NOAA.png 1,000 × 710; 48 KB
-
 2008-08-14 500-Millibar Height Contour Map NOAA.png 1,039 × 779; 73 KB
-
 2008-08-14 Color Max-min Temperature Map NOAA.png 800 × 350; 21 KB
-
 2008-08-14 Max-min Temperature Map NOAA.png 1,000 × 710; 50 KB
-
 2008-08-14 Surface Weather Map NOAA.png 1,088 × 783; 46 KB
-
 2008-08-15 24-hr Precipitation Map NOAA.png 1,000 × 710; 50 KB
-
 2008-08-15 500-Millibar Height Contour Map NOAA.png 1,039 × 779; 73 KB
-
 2008-08-15 Color Max-min Temperature Map NOAA.png 800 × 350; 22 KB
-
 2008-08-15 Max-min Temperature Map NOAA.png 1,000 × 710; 50 KB
-
 2008-08-15 Surface Weather Map NOAA.png 1,088 × 783; 45 KB
-
 2008-08-16 24-hr Precipitation Map NOAA.png 1,000 × 710; 46 KB
-
 2008-08-16 500-Millibar Height Contour Map NOAA.png 1,039 × 779; 74 KB
-
 2008-08-16 Color Max-min Temperature Map NOAA.png 800 × 350; 22 KB
-
 2008-08-16 Max-min Temperature Map NOAA.png 1,000 × 710; 50 KB
-
 2008-08-16 Surface Weather Map NOAA.png 1,088 × 783; 48 KB
-
 2008-08-17 24-hr Precipitation Map NOAA.png 1,000 × 710; 47 KB
-
 2008-08-17 500-Millibar Height Contour Map NOAA.png 1,039 × 779; 76 KB
-
 2008-08-17 Color Max-min Temperature Map NOAA.png 800 × 350; 22 KB
-
 2008-08-17 Max-min Temperature Map NOAA.png 1,000 × 710; 50 KB
-
 2008-08-17 Surface Weather Map NOAA.png 1,088 × 783; 47 KB
-
 2008-08-18 24-hr Precipitation Map NOAA.png 1,000 × 710; 45 KB
-
 2008-08-18 500-Millibar Height Contour Map NOAA.png 1,039 × 779; 74 KB
-
 2008-08-18 Color Max-min Temperature Map NOAA.png 800 × 350; 22 KB
-
 2008-08-18 Max-min Temperature Map NOAA.png 1,000 × 710; 50 KB
-
 2008-08-18 Surface Weather Map NOAA.png 1,088 × 783; 48 KB
-
 2008-08-19 24-hr Precipitation Map NOAA.png 1,000 × 710; 46 KB
-
 2008-08-19 500-Millibar Height Contour Map NOAA.png 1,039 × 779; 75 KB
-
 2008-08-19 Color Max-min Temperature Map NOAA.png 800 × 350; 21 KB
-
 2008-08-19 Max-min Temperature Map NOAA.png 1,000 × 710; 50 KB
-
 2008-08-19 Surface Weather Map NOAA.png 1,088 × 783; 51 KB
-
 2008-08-20 24-hr Precipitation Map NOAA.png 1,000 × 710; 44 KB
-
 2008-08-20 500-Millibar Height Contour Map NOAA.png 1,039 × 779; 78 KB
-
 2008-08-20 Color Max-min Temperature Map NOAA.png 800 × 350; 22 KB
-
 2008-08-20 Max-min Temperature Map NOAA.png 1,000 × 710; 50 KB
-
 2008-08-20 Surface Weather Map NOAA.png 1,088 × 783; 51 KB
-
 2008-08-21 24-hr Precipitation Map NOAA.png 1,000 × 710; 46 KB
-
 2008-08-21 500-Millibar Height Contour Map NOAA.png 1,039 × 779; 76 KB
-
 2008-08-21 Color Max-min Temperature Map NOAA.png 800 × 350; 21 KB
-
 2008-08-21 Max-min Temperature Map NOAA.png 1,000 × 710; 50 KB
-
 2008-08-21 Surface Weather Map NOAA.png 1,088 × 783; 50 KB
-
 2008-08-22 24-hr Precipitation Map NOAA.png 1,000 × 710; 44 KB
-
 2008-08-22 500-Millibar Height Contour Map NOAA.png 1,039 × 779; 74 KB
-
 2008-08-22 Color Max-min Temperature Map NOAA.png 800 × 350; 21 KB
-
 2008-08-22 Max-min Temperature Map NOAA.png 1,000 × 710; 50 KB
-
 2008-08-22 Surface Weather Map NOAA.png 1,088 × 783; 50 KB
-
 2008-08-23 24-hr Precipitation Map NOAA.png 1,000 × 710; 45 KB
-
 2008-08-23 500-Millibar Height Contour Map NOAA.png 1,039 × 779; 74 KB
-
 2008-08-23 Color Max-min Temperature Map NOAA.png 800 × 350; 21 KB
-
 2008-08-23 Max-min Temperature Map NOAA.png 1,000 × 710; 50 KB
-
 2008-08-23 Surface Weather Map NOAA.png 1,088 × 783; 50 KB
-
 2008-08-24 24-hr Precipitation Map NOAA.png 1,000 × 710; 46 KB
-
 2008-08-24 500-Millibar Height Contour Map NOAA.png 1,039 × 779; 77 KB
-
 2008-08-24 Color Max-min Temperature Map NOAA.png 800 × 350; 21 KB
-
 2008-08-24 Max-min Temperature Map NOAA.png 1,000 × 710; 50 KB
-
 2008-08-24 Surface Weather Map NOAA.png 1,088 × 783; 48 KB
-
 2008-08-25 24-hr Precipitation Map NOAA.png 1,000 × 710; 47 KB
-
 2008-08-25 500-Millibar Height Contour Map NOAA.png 1,039 × 779; 76 KB
-
 2008-08-25 Color Max-min Temperature Map NOAA.png 800 × 350; 21 KB
-
 2008-08-25 Max-min Temperature Map NOAA.png 1,000 × 710; 50 KB
-
 2008-08-25 Surface Weather Map NOAA.png 1,088 × 783; 48 KB
-
 2008-08-26 24-hr Precipitation Map NOAA.png 1,000 × 710; 48 KB
-
 2008-08-26 500-Millibar Height Contour Map NOAA.png 1,039 × 779; 75 KB
-
 2008-08-26 Color Max-min Temperature Map NOAA.png 800 × 350; 22 KB
-
 2008-08-26 Max-min Temperature Map NOAA.png 1,000 × 710; 50 KB
-
 2008-08-26 Surface Weather Map NOAA.png 1,088 × 783; 49 KB
-
 2008-08-27 24-hr Precipitation Map NOAA.png 1,000 × 710; 46 KB
-
 2008-08-27 500-Millibar Height Contour Map NOAA.png 1,039 × 779; 75 KB
-
 2008-08-27 Color Max-min Temperature Map NOAA.png 800 × 350; 22 KB
-
 2008-08-27 Max-min Temperature Map NOAA.png 1,000 × 710; 50 KB
-
 2008-08-27 Surface Weather Map NOAA.png 1,088 × 783; 51 KB
-
 2008-08-28 24-hr Precipitation Map NOAA.png 1,000 × 710; 48 KB
-
 2008-08-28 500-Millibar Height Contour Map NOAA.png 1,039 × 779; 74 KB
-
 2008-08-28 Color Max-min Temperature Map NOAA.png 800 × 350; 22 KB
-
 2008-08-28 Max-min Temperature Map NOAA.png 1,000 × 710; 50 KB
-
 2008-08-28 Surface Weather Map NOAA.png 1,088 × 783; 47 KB
-
 2008-08-29 24-hr Precipitation Map NOAA.png 1,000 × 710; 47 KB
-
 2008-08-29 500-Millibar Height Contour Map NOAA.png 1,039 × 779; 73 KB
-
 2008-08-29 Color Max-min Temperature Map NOAA.png 800 × 350; 22 KB
-
 2008-08-29 Max-min Temperature Map NOAA.png 1,000 × 710; 50 KB
-
 2008-08-29 Surface Weather Map NOAA.png 1,088 × 783; 46 KB
-
 2008-08-30 24-hr Precipitation Map NOAA.png 1,000 × 710; 47 KB
-
 2008-08-30 500-Millibar Height Contour Map NOAA.png 1,039 × 779; 73 KB
-
 2008-08-30 Color Max-min Temperature Map NOAA.png 800 × 350; 21 KB
-
 2008-08-30 Max-min Temperature Map NOAA.png 1,000 × 710; 50 KB
-
 2008-08-30 Surface Weather Map NOAA.png 1,088 × 783; 46 KB
-
 2008-08-31 24-hr Precipitation Map NOAA.png 1,000 × 710; 49 KB
-
 2008-08-31 500-Millibar Height Contour Map NOAA.png 1,039 × 779; 77 KB
-
 2008-08-31 Color Max-min Temperature Map NOAA.png 800 × 350; 22 KB
-
 2008-08-31 Max-min Temperature Map NOAA.png 1,000 × 710; 50 KB
-
 2008-08-31 Surface Weather Map NOAA.png 1,088 × 783; 49 KB


