Category:NCEP weather maps for February 2006
Media in category "NCEP weather maps for February 2006"
The following 140 files are in this category, out of 140 total.
-
 2006-02-01 24-hr Precipitation Map NOAA.png 1,000 × 710; 47 KB
-
 2006-02-01 500-Millibar Height Contour Map NOAA.png 1,039 × 779; 42 KB
-
 2006-02-01 Color Max-min Temperature Map NOAA.png 800 × 350; 22 KB
-
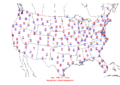
 2006-02-01 Max-min Temperature Map NOAA.png 1,000 × 710; 50 KB
-
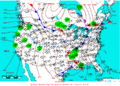
 2006-02-01 Surface Weather Map NOAA.png 1,088 × 783; 56 KB
-
 2006-02-02 24-hr Precipitation Map NOAA.png 1,000 × 710; 45 KB
-
 2006-02-02 500-Millibar Height Contour Map NOAA.png 1,039 × 779; 81 KB
-
 2006-02-02 Color Max-min Temperature Map NOAA.png 800 × 350; 22 KB
-
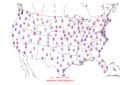
 2006-02-02 Max-min Temperature Map NOAA.png 1,000 × 710; 50 KB
-
 2006-02-02 Surface Weather Map NOAA.png 1,088 × 783; 53 KB
-
 2006-02-03 24-hr Precipitation Map NOAA.png 1,000 × 710; 51 KB
-
 2006-02-03 500-Millibar Height Contour Map NOAA.png 1,039 × 779; 42 KB
-
 2006-02-03 Color Max-min Temperature Map NOAA.png 800 × 350; 22 KB
-
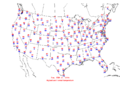
 2006-02-03 Max-min Temperature Map NOAA.png 1,000 × 710; 50 KB
-
 2006-02-03 Surface Weather Map NOAA.png 1,088 × 783; 55 KB
-
 2006-02-04 24-hr Precipitation Map NOAA.png 1,000 × 710; 50 KB
-
 2006-02-04 500-Millibar Height Contour Map NOAA.png 1,039 × 779; 44 KB
-
 2006-02-04 Color Max-min Temperature Map NOAA.png 800 × 350; 23 KB
-
 2006-02-04 Max-min Temperature Map NOAA.png 1,000 × 710; 50 KB
-
 2006-02-04 Surface Weather Map NOAA.png 1,088 × 783; 57 KB
-
 2006-02-05 24-hr Precipitation Map NOAA.png 1,000 × 710; 48 KB
-
 2006-02-05 500-Millibar Height Contour Map NOAA.png 1,039 × 779; 44 KB
-
 2006-02-05 Color Max-min Temperature Map NOAA.png 800 × 350; 23 KB
-
 2006-02-05 Max-min Temperature Map NOAA.png 1,000 × 710; 50 KB
-
 2006-02-05 Surface Weather Map NOAA.png 1,088 × 783; 58 KB
-
 2006-02-06 24-hr Precipitation Map NOAA.png 1,000 × 710; 46 KB
-
 2006-02-06 500-Millibar Height Contour Map NOAA.png 1,039 × 779; 44 KB
-
 2006-02-06 Color Max-min Temperature Map NOAA.png 800 × 350; 23 KB
-
 2006-02-06 Max-min Temperature Map NOAA.png 1,000 × 710; 50 KB
-
 2006-02-06 Surface Weather Map NOAA.png 1,088 × 783; 55 KB
-
 2006-02-07 24-hr Precipitation Map NOAA.png 1,000 × 710; 47 KB
-
 2006-02-07 500-Millibar Height Contour Map NOAA.png 1,039 × 779; 44 KB
-
 2006-02-07 Color Max-min Temperature Map NOAA.png 800 × 350; 22 KB
-
 2006-02-07 Max-min Temperature Map NOAA.png 1,000 × 710; 49 KB
-
 2006-02-07 Surface Weather Map NOAA.png 1,088 × 783; 55 KB
-
 2006-02-08 24-hr Precipitation Map NOAA.png 1,000 × 710; 45 KB
-
 2006-02-08 500-Millibar Height Contour Map NOAA.png 1,039 × 779; 44 KB
-
 2006-02-08 Color Max-min Temperature Map NOAA.png 800 × 350; 22 KB
-
 2006-02-08 Max-min Temperature Map NOAA.png 1,000 × 710; 50 KB
-
 2006-02-08 Surface Weather Map NOAA.png 1,088 × 783; 55 KB
-
 2006-02-09 24-hr Precipitation Map NOAA.png 1,000 × 710; 46 KB
-
 2006-02-09 500-Millibar Height Contour Map NOAA.png 1,039 × 779; 46 KB
-
 2006-02-09 Color Max-min Temperature Map NOAA.png 800 × 350; 22 KB
-
 2006-02-09 Max-min Temperature Map NOAA.png 1,000 × 710; 50 KB
-
 2006-02-09 Surface Weather Map NOAA.png 1,088 × 783; 54 KB
-
 2006-02-10 24-hr Precipitation Map NOAA.png 1,000 × 710; 48 KB
-
 2006-02-10 500-Millibar Height Contour Map NOAA.png 1,039 × 779; 45 KB
-
 2006-02-10 Color Max-min Temperature Map NOAA.png 800 × 350; 22 KB
-
 2006-02-10 Max-min Temperature Map NOAA.png 1,000 × 710; 50 KB
-
 2006-02-10 Surface Weather Map NOAA.png 1,088 × 783; 56 KB
-
 2006-02-11 24-hr Precipitation Map NOAA.png 1,000 × 710; 49 KB
-
 2006-02-11 500-Millibar Height Contour Map NOAA.png 1,039 × 779; 47 KB
-
 2006-02-11 Color Max-min Temperature Map NOAA.png 800 × 350; 23 KB
-
 2006-02-11 Max-min Temperature Map NOAA.png 1,000 × 710; 49 KB
-
 2006-02-11 Surface Weather Map NOAA.png 1,088 × 783; 55 KB
-
 2006-02-12 24-hr Precipitation Map NOAA.png 1,000 × 710; 49 KB
-
 2006-02-12 500-Millibar Height Contour Map NOAA.png 1,039 × 779; 47 KB
-
 2006-02-12 Color Max-min Temperature Map NOAA.png 800 × 350; 23 KB
-
 2006-02-12 Max-min Temperature Map NOAA.png 1,000 × 710; 49 KB
-
 2006-02-12 Surface Weather Map NOAA.png 1,088 × 783; 58 KB
-
 2006-02-13 24-hr Precipitation Map NOAA.png 1,000 × 710; 46 KB
-
 2006-02-13 500-Millibar Height Contour Map NOAA.png 1,039 × 779; 48 KB
-
 2006-02-13 Color Max-min Temperature Map NOAA.png 800 × 350; 22 KB
-
 2006-02-13 Max-min Temperature Map NOAA.png 1,000 × 710; 49 KB
-
 2006-02-13 Surface Weather Map NOAA.png 1,088 × 783; 55 KB
-
 2006-02-14 24-hr Precipitation Map NOAA.png 1,000 × 710; 44 KB
-
 2006-02-14 500-Millibar Height Contour Map NOAA.png 1,039 × 779; 44 KB
-
 2006-02-14 Color Max-min Temperature Map NOAA.png 800 × 350; 22 KB
-
 2006-02-14 Max-min Temperature Map NOAA.png 1,000 × 710; 50 KB
-
 2006-02-14 Surface Weather Map NOAA.png 1,088 × 783; 52 KB
-
 2006-02-15 24-hr Precipitation Map NOAA.png 1,000 × 710; 46 KB
-
 2006-02-15 500-Millibar Height Contour Map NOAA.png 1,039 × 779; 44 KB
-
 2006-02-15 Color Max-min Temperature Map NOAA.png 800 × 350; 22 KB
-
 2006-02-15 Max-min Temperature Map NOAA.png 1,000 × 710; 49 KB
-
 2006-02-15 Surface Weather Map NOAA.png 1,088 × 783; 56 KB
-
 2006-02-16 24-hr Precipitation Map NOAA.png 1,000 × 710; 47 KB
-
 2006-02-16 500-Millibar Height Contour Map NOAA.png 1,039 × 779; 44 KB
-
 2006-02-16 Color Max-min Temperature Map NOAA.png 800 × 350; 23 KB
-
 2006-02-16 Max-min Temperature Map NOAA.png 1,000 × 710; 49 KB
-
 2006-02-16 Surface Weather Map NOAA.png 1,088 × 783; 55 KB
-
 2006-02-17 24-hr Precipitation Map NOAA.png 1,000 × 710; 49 KB
-
 2006-02-17 500-Millibar Height Contour Map NOAA.png 1,039 × 779; 44 KB
-
 2006-02-17 Color Max-min Temperature Map NOAA.png 800 × 350; 23 KB
-
 2006-02-17 Max-min Temperature Map NOAA.png 1,000 × 710; 49 KB
-
 2006-02-17 Surface Weather Map NOAA.png 1,088 × 783; 58 KB
-
 2006-02-18 24-hr Precipitation Map NOAA.png 1,000 × 710; 51 KB
-
 2006-02-18 500-Millibar Height Contour Map NOAA.png 1,039 × 779; 44 KB
-
 2006-02-18 Color Max-min Temperature Map NOAA.png 800 × 350; 24 KB
-
 2006-02-18 Max-min Temperature Map NOAA.png 1,000 × 710; 49 KB
-
 2006-02-18 Surface Weather Map NOAA.png 1,088 × 783; 58 KB
-
 2006-02-19 24-hr Precipitation Map NOAA.png 1,000 × 710; 51 KB
-
 2006-02-19 500-Millibar Height Contour Map NOAA.png 1,039 × 779; 43 KB
-
 2006-02-19 Color Max-min Temperature Map NOAA.png 800 × 350; 23 KB
-
 2006-02-19 Max-min Temperature Map NOAA.png 1,000 × 710; 48 KB
-
 2006-02-19 Surface Weather Map NOAA.png 1,088 × 783; 55 KB
-
 2006-02-20 24-hr Precipitation Map NOAA.png 1,000 × 710; 50 KB
-
 2006-02-20 500-Millibar Height Contour Map NOAA.png 1,039 × 779; 43 KB
-
 2006-02-20 Color Max-min Temperature Map NOAA.png 800 × 350; 22 KB
-
 2006-02-20 Max-min Temperature Map NOAA.png 1,000 × 710; 49 KB
-
 2006-02-20 Surface Weather Map NOAA.png 1,088 × 783; 54 KB
-
 2006-02-21 24-hr Precipitation Map NOAA.png 1,000 × 710; 48 KB
-
 2006-02-21 500-Millibar Height Contour Map NOAA.png 1,039 × 779; 44 KB
-
 2006-02-21 Color Max-min Temperature Map NOAA.png 800 × 350; 22 KB
-
 2006-02-21 Max-min Temperature Map NOAA.png 1,000 × 710; 49 KB
-
 2006-02-21 Surface Weather Map NOAA.png 1,088 × 783; 53 KB
-
 2006-02-22 24-hr Precipitation Map NOAA.png 1,000 × 710; 48 KB
-
 2006-02-22 500-Millibar Height Contour Map NOAA.png 1,039 × 779; 43 KB
-
 2006-02-22 Color Max-min Temperature Map NOAA.png 800 × 350; 23 KB
-
 2006-02-22 Max-min Temperature Map NOAA.png 1,000 × 710; 50 KB
-
 2006-02-22 Surface Weather Map NOAA.png 1,088 × 783; 51 KB
-
 2006-02-23 24-hr Precipitation Map NOAA.png 1,000 × 710; 47 KB
-
 2006-02-23 500-Millibar Height Contour Map NOAA.png 1,039 × 779; 42 KB
-
 2006-02-23 Color Max-min Temperature Map NOAA.png 800 × 350; 22 KB
-
 2006-02-23 Max-min Temperature Map NOAA.png 1,000 × 710; 50 KB
-
 2006-02-23 Surface Weather Map NOAA.png 1,088 × 783; 52 KB
-
 2006-02-24 24-hr Precipitation Map NOAA.png 1,000 × 710; 47 KB
-
 2006-02-24 500-Millibar Height Contour Map NOAA.png 1,039 × 779; 42 KB
-
 2006-02-24 Color Max-min Temperature Map NOAA.png 800 × 350; 22 KB
-
 2006-02-24 Max-min Temperature Map NOAA.png 1,000 × 710; 50 KB
-
 2006-02-24 Surface Weather Map NOAA.png 1,088 × 783; 54 KB
-
 2006-02-25 24-hr Precipitation Map NOAA.png 1,000 × 710; 46 KB
-
 2006-02-25 500-Millibar Height Contour Map NOAA.png 1,039 × 779; 41 KB
-
 2006-02-25 Color Max-min Temperature Map NOAA.png 800 × 350; 22 KB
-
 2006-02-25 Max-min Temperature Map NOAA.png 1,000 × 710; 49 KB
-
 2006-02-25 Surface Weather Map NOAA.png 1,088 × 783; 53 KB
-
 2006-02-26 24-hr Precipitation Map NOAA.png 1,000 × 710; 46 KB
-
 2006-02-26 500-Millibar Height Contour Map NOAA.png 1,039 × 779; 44 KB
-
 2006-02-26 Color Max-min Temperature Map NOAA.png 800 × 350; 23 KB
-
 2006-02-26 Max-min Temperature Map NOAA.png 1,000 × 710; 49 KB
-
 2006-02-26 Surface Weather Map NOAA.png 1,088 × 783; 58 KB
-
 2006-02-27 24-hr Precipitation Map NOAA.png 1,000 × 710; 44 KB
-
 2006-02-27 500-Millibar Height Contour Map NOAA.png 1,039 × 779; 46 KB
-
 2006-02-27 Color Max-min Temperature Map NOAA.png 800 × 350; 22 KB
-
 2006-02-27 Max-min Temperature Map NOAA.png 1,000 × 710; 50 KB
-
 2006-02-27 Surface Weather Map NOAA.png 1,088 × 783; 57 KB
-
 2006-02-28 24-hr Precipitation Map NOAA.png 1,000 × 710; 46 KB
-
 2006-02-28 500-Millibar Height Contour Map NOAA.png 1,039 × 779; 47 KB
-
 2006-02-28 Color Max-min Temperature Map NOAA.png 800 × 350; 22 KB
-
 2006-02-28 Max-min Temperature Map NOAA.png 1,000 × 710; 49 KB
-
 2006-02-28 Surface Weather Map NOAA.png 1,088 × 783; 55 KB


