Category:Odonata distribution maps
Media in category "Odonata distribution maps"
The following 200 files are in this category, out of 475 total.
(previous page) (next page)-
 Acanthaeschna victoria distribution map.svg 1,000 × 921; 978 KB
-
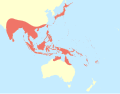
 Aciagrion fragilis distribution map AU+PNG.svg 1,000 × 839; 1.78 MB
-
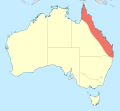
 Aciagrion fragilis distribution map.svg 1,000 × 921; 1.02 MB
-
 Aciagrion probable distribution map.svg 1,200 × 680; 14.96 MB
-
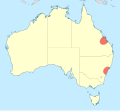
 Adversaeschna brevistyla distribution map AU.svg 1,000 × 921; 1.13 MB
-
 Adversaeschna brevistyla distribution map.svg 1,000 × 839; 1.78 MB
-
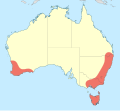
 Aethriamanta circumsignata distribution map.svg 1,000 × 921; 1.08 MB
-
 Aethriamanta nymphaeae distribution map AU.svg 1,000 × 921; 1.05 MB
-
 Aethriamanta nymphaeae distribution map.svg 1,000 × 839; 1.71 MB
-
 Agriocnemis argentea distribution map.svg 1,000 × 921; 1,010 KB
-
 Agriocnemis dobsoni distribution map.svg 1,000 × 921; 947 KB
-
 Agriocnemis femina distribution map.svg 1,000 × 780; 5.32 MB
-
 Agriocnemis kunjina distribution map.svg 1,000 × 921; 951 KB
-
 Agriocnemis probable distribution map.svg 1,200 × 680; 15.31 MB
-
 Agriocnemis pygmaea distribution map AU.svg 1,000 × 921; 1.12 MB
-
 Agriocnemis pygmaea distribution map.svg 1,200 × 680; 16.57 MB
-
 Agriocnemis rubricauda distribution map.svg 1,000 × 921; 1,019 KB
-
 Agrionoptera insignis distribution map AU.svg 1,000 × 921; 1.04 MB
-
 Agrionoptera insignis distribution map.svg 1,000 × 780; 5.15 MB
-
 Agrionoptera longitudinalis distribution map AU.svg 1,000 × 921; 971 KB
-
 Agrionoptera longitudinalis distribution map.svg 1,000 × 839; 1.72 MB
-
 Agyrtacantha dirupta distribution map AU.svg 1,000 × 921; 957 KB
-
 Agyrtacantha dirupta distribution map.svg 1,000 × 839; 1.78 MB
-
 Amanipodagrion gilliesi distribution map.svg 1,549 × 1,475; 1.59 MB
-
 Anaciaeschna jaspidea distribution map AU.svg 1,000 × 921; 1,017 KB
-
 Anaciaeschna jaspidea distribution map.svg 1,000 × 780; 5.37 MB
-
 Anax georgius distribution map AU.svg 1,000 × 921; 984 KB
-
 Anax georgius distribution map.svg 1,000 × 839; 1.65 MB
-
 Anax gibbosulus distribution map AU.svg 1,000 × 921; 1.05 MB
-
 Anax gibbosulus distribution map.svg 1,000 × 723; 1.6 MB
-
 Anax guttatus distribution map AU.svg 1,000 × 921; 1.02 MB
-
 Anax guttatus distribution map.svg 1,000 × 780; 5.52 MB
-
 Anax papuensis distribution map AU.svg 1,000 × 921; 1.25 MB
-
 Anax papuensis distribution map.svg 1,000 × 839; 1.99 MB
-
 Antipodogomphus acolythus distribution map.svg 1,000 × 921; 1.01 MB
-
 Antipodogomphus dentosus distribution map.svg 1,000 × 921; 940 KB
-
 Antipodogomphus distribution map.svg 1,000 × 921; 1.11 MB
-
 Antipodogomphus edentulus distribution map.svg 1,000 × 921; 963 KB
-
 Antipodogomphus hodgkini distribution map.svg 1,000 × 921; 956 KB
-
 Antipodogomphus neophytus distribution map.svg 1,000 × 921; 1.04 MB
-
 Antipodogomphus proselythus distribution map.svg 1,000 × 921; 1,018 KB
-
 Antipodophlebia asthenes distribution map.svg 1,000 × 921; 979 KB
-
 Apocordulia macrops distribution map.svg 1,000 × 921; 973 KB
-
 Archaeophya adamsi distribution map.svg 1,000 × 921; 957 KB
-
 Archaeophya distribution map.svg 1,000 × 921; 968 KB
-
 Archaeophya magnifica distribution map.svg 1,000 × 921; 951 KB
-
 Archaeosynthemis distribution map.svg 1,000 × 921; 1.03 MB
-
 Archaeosynthemis leachii distribution map.svg 1,000 × 921; 950 KB
-
 Archaeosynthemis occidentalis distribution map.svg 1,000 × 921; 958 KB
-
 Archaeosynthemis orientalis distribution map.svg 1,000 × 921; 1.02 MB
-
 Archaeosynthemis spiniger distribution map.svg 1,000 × 921; 944 KB
-
 Archiargiolestes distribution map.svg 1,000 × 921; 952 KB
-
 Archiargiolestes parvulus distribution map.svg 1,000 × 921; 945 KB
-
 Archiargiolestes pusillissimus distribution map.svg 1,000 × 921; 945 KB
-
 Archiargiolestes pusillus distribution map.svg 1,000 × 921; 951 KB
-
 Archibasis mimetes distribution map AU.svg 1,000 × 921; 993 KB
-
 Archibasis mimetes distribution map.svg 1,000 × 839; 1.71 MB
-
 Archibasis probable distribution map.svg 1,000 × 780; 5.19 MB
-
 Archipetalia auriculata distribution map.svg 1,000 × 921; 966 KB
-
 Argia tezpi distribution.jpg 1,056 × 816; 362 KB
-
 Argiocnemis rubescens distribution map AU.svg 1,000 × 921; 1.32 MB
-
 Argiocnemis rubescens distribution map.svg 1,000 × 780; 5.15 MB
-
 Armagomphus armiger distribution map.svg 1,000 × 921; 946 KB
-
 Austroaeschna anacantha distribution map.svg 1,000 × 921; 949 KB
-
 Austroaeschna atrata distribution map.svg 1,000 × 921; 987 KB
-
 Austroaeschna christine distribution map.svg 1,000 × 921; 951 KB
-
 Austroaeschna cooloola distribution map.svg 1,000 × 921; 957 KB
-
 Austroaeschna distribution map.svg 1,000 × 921; 1.13 MB
-
 Austroaeschna eungella distribution map.svg 1,000 × 921; 952 KB
-
 Austroaeschna flavomaculata distribution map.svg 1,000 × 921; 985 KB
-
 Austroaeschna hardyi distribution map.svg 1,000 × 921; 966 KB
-
 Austroaeschna inermis distribution map.svg 1,000 × 921; 996 KB
-
 Austroaeschna ingrid distribution map.svg 1,000 × 921; 943 KB
-
 Austroaeschna muelleri distribution map.svg 1,000 × 921; 941 KB
-
 Austroaeschna multipunctata distribution map.svg 1,000 × 921; 1.01 MB
-
 Austroaeschna obscura distribution map.svg 1,000 × 921; 958 KB
-
 Austroaeschna parvistigma distribution map.svg 1,000 × 921; 1.05 MB
-
 Austroaeschna pinheyi distribution map.svg 1,000 × 921; 942 KB
-
 Austroaeschna pulchra distribution map.svg 1,000 × 921; 1.03 MB
-
 Austroaeschna sigma distribution map.svg 1,000 × 921; 980 KB
-
 Austroaeschna speciosa distribution map.svg 1,000 × 921; 950 KB
-
 Austroaeschna subapicalis distribution map.svg 1,000 × 921; 1,011 KB
-
 Austroaeschna tasmanica distribution map.svg 1,000 × 921; 972 KB
-
 Austroaeschna unicornis distribution map.svg 1,000 × 921; 1.07 MB
-
 Austroagrion cyane distribution map.svg 1,000 × 921; 1.13 MB
-
 Austroagrion distribution map.svg 1,000 × 839; 1.8 MB
-
 Austroagrion exclamationis distribution map AU.svg 1,000 × 921; 1.09 MB
-
 Austroagrion exclamationis distribution map.svg 1,000 × 839; 1.71 MB
-
 Austroagrion pindrina distribution map.svg 1,000 × 921; 958 KB
-
 Austroagrion watsoni distribution map AU.svg 1,000 × 921; 1.19 MB
-
 Austroagrion watsoni distribution map.svg 1,000 × 839; 1.77 MB
-
 Austroargiolestes alpinus distribution map.svg 1,000 × 921; 947 KB
-
 Austroargiolestes amabilis distribution map.svg 1,000 × 921; 691 KB
-
 Austroargiolestes aureus distribution map.svg 1,000 × 921; 950 KB
-
 Austroargiolestes brookhousei distribution map.svg 1,000 × 921; 944 KB
-
 Austroargiolestes calcaris distribution map.svg 1,000 × 921; 984 KB
-
 Austroargiolestes christine distribution map.svg 1,000 × 921; 943 KB
-
 Austroargiolestes chrysoides distribution map.svg 1,000 × 921; 955 KB
-
 Austroargiolestes distribution map.svg 1,000 × 921; 1.03 MB
-
 Austroargiolestes elke distribution map.svg 1,000 × 921; 949 KB
-
 Austroargiolestes icteromelas distribution map.svg 1,000 × 921; 1.03 MB
-
 Austroargiolestes isabellae distribution map.svg 1,000 × 921; 947 KB
-
 Austrocnemis distribution map.svg 1,000 × 839; 1.72 MB
-
 Austrocnemis maccullochi distribution map AU.svg 1,000 × 921; 1 MB
-
 Austrocnemis maccullochi distribution map.svg 1,000 × 839; 1.66 MB
-
 Austrocnemis obscura distribution map.svg 1,000 × 921; 987 KB
-
 Austrocnemis splendida distribution map.svg 1,000 × 921; 1.02 MB
-
 Austrocordulia distribution map.svg 1,000 × 921; 1.08 MB
-
 Austrocordulia leonardi distribution map.svg 1,000 × 921; 947 KB
-
 Austrocordulia refracta distribution map.svg 1,000 × 921; 1 MB
-
 Austrocordulia territoria distribution map.svg 1,000 × 921; 1,013 KB
-
 Austrogomphus amphiclitus distribution map.svg 1,000 × 921; 1.02 MB
-
 Austrogomphus angelorum distribution map.svg 1,000 × 921; 966 KB
-
 Austrogomphus arbustorum distribution map.svg 1,000 × 921; 1,015 KB
-
 Austrogomphus australis distribution map.svg 1,000 × 921; 1.04 MB
-
 Austrogomphus bifurcatus distribution map.svg 1,000 × 921; 953 KB
-
 Austrogomphus collaris distribution map.svg 1,000 × 921; 958 KB
-
 Austrogomphus cornutus distribution map.svg 1,000 × 921; 1.06 MB
-
 Austrogomphus distribution map.svg 1,000 × 921; 1.11 MB
-
 Austrogomphus divaricatus distribution map.svg 1,000 × 921; 958 KB
-
 Austrogomphus doddi distribution map.svg 1,000 × 921; 955 KB
-
 Austrogomphus gordoni distribution map.svg 1,000 × 921; 1.06 MB
-
 Austrogomphus guerini distribution map.svg 1,000 × 921; 1.08 MB
-
 Austrogomphus mjobergi distribution map.svg 1,000 × 921; 1.07 MB
-
 Austrogomphus mouldsorum distribution map.svg 1,000 × 921; 966 KB
-
 Austrogomphus ochraceus distribution map.svg 1,000 × 921; 1.06 MB
-
 Austrogomphus praeruptus distribution map.svg 1,000 × 921; 1.02 MB
-
 Austrogomphus prasinus distribution map.svg 1,000 × 921; 971 KB
-
 Austrogomphus pusillus distribution map.svg 1,000 × 921; 986 KB
-
 Austrogomphus turneri distribution map.svg 1,000 × 921; 1.07 MB
-
 Austrogynacantha heterogena distribution map AU.svg 1,000 × 921; 1.15 MB
-
 Austrogynacantha heterogena distribution map.svg 1,000 × 839; 1.74 MB
-
 Austrolestes aleison distribution map.svg 1,000 × 921; 955 KB
-
 Austrolestes analis distribution map.svg 1,000 × 921; 1.08 MB
-
 Austrolestes annulosus distribution map.svg 1,000 × 921; 1.11 MB
-
 Austrolestes aridus distribution map.svg 1,000 × 921; 1.15 MB
-
 Austrolestes cingulatus distribution map.svg 1,000 × 921; 1.05 MB
-
 Austrolestes insularis distribution map.svg 1,000 × 921; 1.08 MB
-
 Austrolestes io distribution map.svg 1,000 × 921; 1.02 MB
-
 Austrolestes leda distribution map.svg 1,000 × 921; 1.1 MB
-
 Austrolestes minjerriba distribution map.svg 1,000 × 921; 969 KB
-
 Austrolestes psyche distribution map.svg 1,000 × 921; 1.08 MB
-
 Austropetalia annaliese distribution map.svg 1,000 × 921; 941 KB
-
 Austropetalia distribution map.svg 1,000 × 921; 986 KB
-
 Austropetalia patricia distribution map.svg 1,000 × 921; 946 KB
-
 Austropetalia tonyana distribution map.svg 1,000 × 921; 984 KB
-
 Austrophlebia costalis distribution map.svg 1,000 × 921; 1,020 KB
-
 Austrophlebia distribution map.svg 1,000 × 921; 1,008 KB
-
 Austrophlebia subcostalis distribution map.svg 1,000 × 921; 951 KB
-
 Austrophya distribution map.png 1,000 × 921; 99 KB
-
 Austrophya distribution map.svg 1,000 × 921; 951 KB
-
 Austrophya monteithorum distribution map.png 1,000 × 921; 88 KB
-
 Austrophya mystica distribution map.svg 1,000 × 921; 951 KB
-
 Austrosticta distribution map.svg 1,000 × 921; 1.06 MB
-
 Austrosticta fieldi distribution map.svg 1,000 × 921; 1.03 MB
-
 Austrosticta frater distribution map.svg 1,000 × 921; 972 KB
-
 Austrosticta soror distribution map.svg 1,000 × 921; 995 KB
-
 Austrosynthemis cyanitincta distribution map.svg 1,000 × 921; 948 KB
-
 Austrothemis nigrescens distribution map.svg 1,000 × 921; 1.03 MB
-
 Brachydiplax denticauda distribution map AU.svg 1,000 × 921; 1.07 MB
-
 Brachydiplax denticauda distribution map.svg 1,000 × 839; 1.83 MB
-
 Brachydiplax duivenbodei distribution map AU.svg 1,000 × 921; 974 KB
-
 Brachydiplax duivenbodei distribution map.svg 1,000 × 780; 4.81 MB
-
 Caliagrion billinghursti distribution map.svg 1,000 × 921; 990 KB
-
 Camacinia othello distribution map AU.svg 1,000 × 921; 1,001 KB
-
 Camacinia othello distribution map.svg 1,000 × 839; 1.78 MB
-
 Ceriagrion aeruginosum distribution map AU.svg 1,000 × 921; 1.09 MB
-
 Ceriagrion aeruginosum distribution map.svg 1,000 × 839; 1.86 MB
-
 Chorismagrion risi distribution map.svg 1,000 × 921; 951 KB
-
 Choristhemis distribution map.svg 1,000 × 921; 1.03 MB
-
 Choristhemis flavoterminata distribution map.svg 1,000 × 921; 1.04 MB
-
 Choristhemis olivei distribution map.svg 1,000 × 921; 949 KB
-
 Coenagrion angulatum Distribution.png 1,665 × 1,120; 264 KB
-
 Coenagrion glaciale Distribution.png 2,373 × 1,051; 356 KB
-
 Coenagrion interrogatum Distribution.png 1,665 × 1,120; 293 KB
-
 Coenagrion lyelli distribution map.svg 1,000 × 921; 1 MB
-
 Coenagrion resolutum Distribution.png 1,665 × 1,120; 301 KB
-
 Cordulephya bidens distribution map.svg 1,000 × 921; 947 KB
-
 Cordulephya distribution map.png 1,000 × 921; 104 KB
-
 Cordulephya distribution map.svg 1,000 × 921; 1.04 MB
-
 Cordulephya divergens distribution map.svg 1,000 × 921; 945 KB
-
 Cordulephya montana distribution map.svg 1,000 × 921; 996 KB
-
 Cordulephya pygmaea distribution map.svg 1,000 × 921; 1.03 MB
-
 Crocothemis nigrifrons distribution map AU.svg 1,000 × 921; 1.24 MB
-
 Crocothemis nigrifrons distribution map.svg 1,000 × 839; 1.88 MB
-
 Dendroaeschna conspersa distribution map.svg 1,000 × 921; 1,022 KB
-
 Diphlebia coerulescens distribution map.svg 1,000 × 921; 997 KB
-
 Diphlebia distribution map.svg 1,000 × 921; 1.06 MB
-
 Diphlebia euphoeoides distribution map AU.svg 1,000 × 921; 981 KB
-
 Diphlebia euphoeoides distribution map.svg 1,000 × 921; 998 KB
-
 Diphlebia hybridoides distribution map.svg 1,000 × 921; 951 KB
-
 Diphlebia lestoides distribution map.svg 1,000 × 921; 1,016 KB
-
 Diphlebia nymphoides distribution map.svg 1,000 × 921; 1.01 MB
-
 Diplacodes bipunctata distribution map AU.svg 1,000 × 921; 1.3 MB
-
 Diplacodes bipunctata distribution map.svg 1,000 × 780; 5.02 MB
-
 Diplacodes haematodes distribution map AU.svg 1,000 × 921; 1.29 MB
-
 Diplacodes haematodes distribution map.svg 1,000 × 839; 1.91 MB
-
 Diplacodes melanopsis distribution map.svg 1,000 × 921; 1.02 MB
-
 Diplacodes nebulosa distribution map AU.svg 1,000 × 921; 1.01 MB
-
 Diplacodes nebulosa distribution map.svg 1,000 × 780; 5.26 MB


