Category:Our World in Data
website that presents data and statistics of socially relevant topics | |||||
| Upload media | |||||
| Instance of |
| ||||
|---|---|---|---|---|---|
| Location | University of Oxford, Oxfordshire, South East England, England | ||||
| Language of work or name | |||||
| Founded by |
| ||||
| Inception |
| ||||
| official website | |||||
| |||||
English: Online publication Our World In Data, that presents empirical research and data that show how living conditions around the world are changing.
Português: Publicação digital Our World In Data, publicação digital especializada em expor pesquisas empíricas e dados analíticos sobre mudanças nas condições de qualidade de vida ao redor do mundo.
Italiano: Pubblicazione su InternetOur World In Data, che presenta ricerca empirica e dati che mostrano come stanno cambiando le condizioni di vita nel mondo.
Español: Publicación en-línea Our World In Data, que presenta datos y resultados empíricos que muestran el cambio en las condiciones de vida en todo mundo.

Subcategories
This category has the following 11 subcategories, out of 11 total.
Pages in category "Our World in Data"
This category contains only the following page.
Media in category "Our World in Data"
The following 200 files are in this category, out of 3,427 total.
(previous page) (next page)-
 10% Share of women in parliament, OWID.svg 850 × 600; 138 KB
-
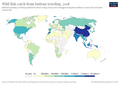
 1970- Decline in species populations - Living Planet Index.svg 1,200 × 675; 6 KB
-

-
 20% Share of women in parliament, OWID.svg 850 × 600; 138 KB
-
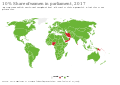
 30% Share of women in parliament, OWID.svg 850 × 600; 138 KB
-
 A long-term timeline of technology, OWID.png 2,456 × 3,261; 676 KB
-
 A-third-of-all-countries-have-had-a-woman-as-leader 5032.png 5,032 × 3,776; 844 KB
-
 Above-ground biomass in forest per hectare, OWID.svg 850 × 600; 140 KB
-
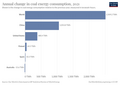
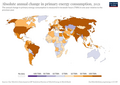 Abs-change-energy-consumption (OWID 0007).png 850 × 600; 107 KB
-
 Absolute increase in global population per year, OWID.svg 850 × 600; 10 KB
-

-
 Absolute-change-co2 (OWID 0005).png 850 × 600; 102 KB
-
 Access to a financial account or services, OWID.svg 850 × 600; 58 KB
-
 Access to clean fuels for cooking vs. GDP per capita, OWID.svg 850 × 600; 42 KB
-
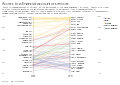
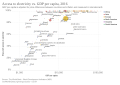 Access to electricity vs. GDP per capita, OWID.svg 850 × 600; 44 KB
-
 Access to electricity, urban vs. rural, OWID.svg 850 × 600; 45 KB
-
 Access-to-basic-resources.png 3,400 × 2,400; 410 KB
-
-
 Access-to-clean-fuels-and-technologies-for-cooking.png 3,400 × 2,400; 806 KB
-
 Access-to-clean-fuels-for-cooking-vs-gdp-per-capita (OWID 0010).png 850 × 600; 98 KB
-
-
 Access-to-electricity-urban-vs-rural (OWID 0011).png 850 × 600; 96 KB
-
 Access-to-electricity-vs-gdp-per-capita (OWID 0041).png 850 × 600; 105 KB
-
 Accumulated Cyclone Energy of North Atlantic hurricanes, OWID.svg 746 × 531; 46 KB
-
 Ace-north-atlantic-hurricanes (OWID 0040).png 850 × 600; 73 KB
-
 Acres-burned-usa (OWID 0039).png 850 × 600; 52 KB
-
 Actual teaching time as share of scheduled teaching time, OWID.svg 850 × 600; 13 KB
-
 Actual teaching time vs time teachers are present, OWID.svg 850 × 600; 10 KB
-
 Additional-extreme-poverty-climate-challenges (OWID 0037).png 850 × 600; 126 KB
-

-

-

-
 Adjusted net saving (current US dollars), OWID.svg 850 × 600; 20 KB
-
 Adjusted net savings per capita, OWID.svg 850 × 600; 19 KB
-
 Adolescent birth rate in women aged 10-19 years, OWID.svg 850 × 600; 140 KB
-
 Adoption of communication technologies, World.png 3,400 × 2,400; 506 KB
-

-
 Adult literacy rate, population 15+ years, female (%), OWID.svg 850 × 600; 141 KB
-
 Adult literacy rate, population 15+ years, male (%), OWID.svg 850 × 600; 141 KB
-
 Age dependency breakdown by young and old dependents, OWID.svg 850 × 600; 22 KB
-
 Age dependency ratio projected to 2100, OWID.svg 850 × 600; 23 KB
-
 Age Dependency Ratio, 2021.png 1,462 × 1,026; 315 KB
-
 Age dependency ratio, OWID.svg 850 × 600; 154 KB
-
 Age of capital stock, OWID.svg 850 × 600; 12 KB
-
 Age of democracies at the end of 2015, OWID.svg 850 × 600; 142 KB
-
 Age of democracies at the end of 2015.svg 850 × 600; 155 KB
-
 Aid received per capita vs. GDP per capita, OWID.svg 850 × 600; 27 KB
-
 Aid received per capita, OWID.svg 850 × 600; 140 KB
-
 Air passengers per fatality, OWID.svg 850 × 600; 6 KB
-
 Air transport, freight (ton-km), OWID.svg 850 × 600; 140 KB
-

-
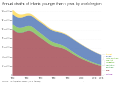
 Air-pollution-deaths-by-age (OWID 0074).png 850 × 600; 59 KB
-
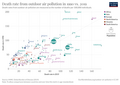
 Air-pollution-deaths-country (OWID 0012).png 850 × 600; 101 KB
-
 Air-pollution-london (OWID 0075).png 850 × 600; 55 KB
-
 Air-pollution-london-vs-delhi (OWID 0076).png 850 × 600; 50 KB
-
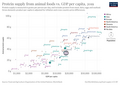
 Air-pollution-vs-gdp-per-capita (OWID 0073).png 850 × 600; 72 KB
-
 Air-transport-freight-ton-km.png 3,400 × 2,400; 820 KB
-
 Ambient-pollution-death-rates-2017-1990 (OWID 0072).png 850 × 600; 97 KB
-
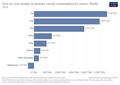
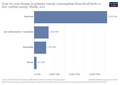
 Animal-protein-consumption (OWID 0070).png 850 × 600; 73 KB
-
 Animal-protein-vs-gdp (OWID 0069).png 850 × 600; 98 KB
-
 Animals-slaughtered-for-meat (OWID 0068).png 850 × 600; 58 KB
-
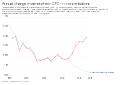 Annual change in atmospheric CFC-11 concentrations, OWID.svg 850 × 600; 6 KB
-
 Annual change in average female height, OWID.svg 850 × 600; 15 KB
-
 Annual change in average male height, OWID.svg 850 × 600; 14 KB
-
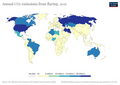
 Annual CO₂ emissions in 2016 vs. 1990, OWID.svg 850 × 600; 41 KB
-
 Annual CO₂ emissions, OWID.svg 850 × 600; 141 KB
-
-
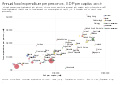 Annual food expenditure per person vs. GDP per capita, OWID.svg 850 × 600; 20 KB
-
 Annual freshwater withdrawals, OWID.svg 850 × 600; 141 KB
-
 Annual greenhouse gas emissions, OWID.svg 850 × 600; 140 KB
-
 Annual growth of GDP per capita, OWID.svg 850 × 600; 140 KB
-
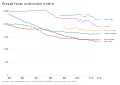
 Annual healthcare expenditure per capita, OWID.svg 850 × 600; 140 KB
-
 Annual Heat Wave Index in the United States, OWID.svg 850 × 600; 10 KB
-
 Annual hours worked per worker, OWID.svg 850 × 600; 23 KB
-
 Annual number of births by world region, OWID.svg 850 × 600; 20 KB
-
 Annual number of deaths by age group in England and Wales, OWID.svg 850 × 600; 26 KB
-
 Annual number of deaths by world region, OWID.svg 850 × 600; 20 KB
-

-

-
 Annual salary of primary teachers with 10 years of experience, OWID.svg 850 × 600; 141 KB
-
 Annual World Population Since 10,000 BC.png 2,674 × 1,881; 209 KB
-
 Annual-afforestation (OWID 0067).png 850 × 600; 112 KB
-
 Annual-change-coal (OWID 0066).png 850 × 600; 49 KB
-
 Annual-change-forest-area.svg 850 × 600; 168 KB
-
 Annual-change-fossil-fuels (OWID 0062).png 850 × 600; 107 KB
-
 Annual-change-gas (OWID 0065).png 850 × 600; 102 KB
-
 Annual-change-hydro (OWID 0063).png 850 × 600; 102 KB
-
 Annual-change-low-carbon-energy (OWID 0061).png 850 × 600; 108 KB
-
 Annual-change-nuclear (OWID 0059).png 850 × 600; 99 KB
-
 Annual-change-oil (OWID 0058).png 850 × 600; 99 KB
-
 Annual-change-primary-energy-source (OWID 0060).png 850 × 600; 60 KB
-
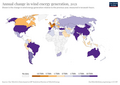
 Annual-change-renewables (OWID 0057).png 850 × 600; 110 KB
-
 Annual-change-solar (OWID 0056).png 850 × 600; 104 KB
-
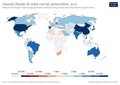
 Annual-change-wind (OWID 0054).png 850 × 600; 101 KB
-
 Annual-co2-cement (OWID 0052).png 850 × 600; 48 KB
-
 Annual-co2-coal (OWID 0051).png 850 × 600; 97 KB
-
 Annual-co2-flaring (OWID 0050).png 850 × 600; 93 KB
-
 Annual-co2-gas (OWID 0049).png 850 × 600; 95 KB
-
 Annual-co2-including-land-use (OWID 0044).png 850 × 600; 112 KB
-
 Annual-co2-oil (OWID 0046).png 850 × 600; 94 KB
-
 Annual-fish-catch-taxa (OWID 0043).png 850 × 600; 106 KB
-
 Annual-percentage-change-coal (OWID 0105).png 850 × 600; 47 KB
-
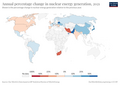
 Annual-percentage-change-fossil-fuels (OWID 0104).png 850 × 600; 102 KB
-
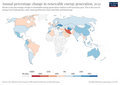
 Annual-percentage-change-gas (OWID 0106).png 850 × 600; 97 KB
-
 Annual-percentage-change-hydro (OWID 0103).png 850 × 600; 49 KB
-
 Annual-percentage-change-low-carbon (OWID 0101).png 850 × 600; 52 KB
-
 Annual-percentage-change-nuclear (OWID 0102).png 850 × 600; 97 KB
-
 Annual-percentage-change-oil (OWID 0099).png 850 × 600; 45 KB
-
 Annual-percentage-change-renewables (OWID 0097).png 850 × 600; 106 KB
-
 Annual-percentage-change-solar (OWID 0098).png 850 × 600; 48 KB
-
 Annual-percentage-change-wind (OWID 0100).png 850 × 600; 101 KB
-
 Annual-primary-energy-fossil-vs-low-carbon (OWID 0096).png 850 × 600; 52 KB
-
 Annual-share-of-co2-emissions (OWID 0093).png 850 × 600; 84 KB
-
 Annual-World-Population-since-10-thousand-BCE-1-768x724.png 747 × 677; 111 KB
-

-

-
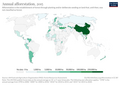
 Antarctic ozone hole area, OWID.svg 850 × 600; 8 KB
-
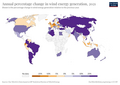
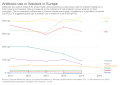 Antibiotic use in livestock in Europe, OWID.svg 850 × 600; 11 KB
-
 Antibiotic use in livestock vs. GDP per capita, OWID.svg 850 × 600; 30 KB
-
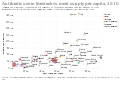 Antibiotic use in livestock vs. meat supply per capita, OWID.svg 850 × 600; 30 KB
-
 Antibiotic use in livestock, OWID.svg 850 × 600; 141 KB
-
 Anxiety disorder DALYs, age-standardized rate, OWID.svg 850 × 600; 140 KB
-
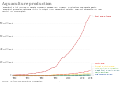 Aquaculture production, OWID.svg 850 × 600; 27 KB
-
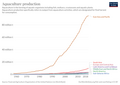 Aquaculture-farmed-fish-production (OWID 0095).png 850 × 600; 74 KB
-

-
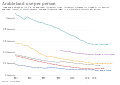 Arable land use per person, OWID.svg 850 × 600; 21 KB
-
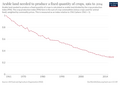 Arable-land-pin (OWID 0090).png 850 × 600; 57 KB
-
 Arctic-sea-ice-coverage-19352014 (OWID 0091).png 850 × 600; 61 KB
-
-
 Are married women required by law to obey their husbands., OWID.svg 850 × 600; 139 KB
-
-

-

-
 Area-land-needed-to-global-oil (OWID 0089).png 850 × 600; 65 KB
-
 Area-meadows-and-pastures (OWID 0087).png 850 × 600; 107 KB
-
 Area-per-tonne-oil (OWID 0088).png 850 × 600; 61 KB
-
 ArgentinaImpact.png 3,400 × 2,400; 417 KB
-
 Armed forces personnel (% of total labor force), OWID.svg 850 × 600; 6 KB
-
 Armed forces personnel as share of total population, OWID.svg 850 × 600; 16 KB
-
 Armed forces personnel, OWID.svg 850 × 600; 17 KB
-
 Asperger Syndrome prevalence in males vs. females, OWID.svg 850 × 600; 41 KB
-
 Asthma prevalence, OWID.svg 850 × 600; 140 KB
-
 Atmospheric CO₂ concentration, OWID.svg 850 × 600; 20 KB
-
 Atms per 100000 adults.png 3,400 × 2,400; 821 KB
-
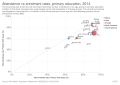 Attendance vs enrolment rates, primary education, OWID.svg 850 × 600; 16 KB
-
 Autism prevalence in males vs. females, OWID.svg 850 × 600; 41 KB
-
 Automated teller machines (ATMs), OWID.svg 850 × 600; 140 KB
-
 Average acres burned per wildfire in the United States, OWID.svg 850 × 600; 9 KB
-
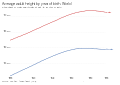 Average adult height by year of birth, OWID.svg 850 × 600; 14 KB
-
 Average annual precipitation by region, OWID.svg 850 × 600; 7 KB
-
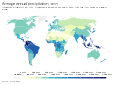 Average annual precipitation, OWID.svg 850 × 600; 143 KB
-
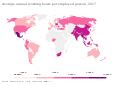 Average annual working hours per employed person, OWID.svg 850 × 600; 139 KB
-
 Average annual working hours vs. GDP per capita, OWID.svg 850 × 600; 17 KB
-
 Average corn yields in the United States, 1866-2014, OWID.svg 850 × 600; 12 KB
-
 Average daily hours of work in summer, by industry, OWID.svg 850 × 600; 12 KB
-
 Average daily hours of work in winter, by industry, OWID.svg 850 × 600; 9 KB
-
 Average daily hours of work, by occupation, United States, OWID.svg 850 × 600; 10 KB
-
 Average daily hours worked, by industry, United States, OWID.svg 850 × 600; 10 KB
-

-
 Average daily work hours, by industry, OWID.svg 850 × 600; 9 KB
-
-
-
 Average height of men by year of birth, 1, OWID.svg 850 × 600; 9 KB
-
 Average height of men by year of birth, 2, OWID.svg 850 × 600; 139 KB
-
 Average height of men by year of birth, OWID.svg 850 × 600; 7 KB
-
 Average height of women by year of birth, OWID.svg 850 × 600; 140 KB
-
 Average hourly earnings of employees, OWID.svg 850 × 600; 141 KB
-
 Average hourly earnings of male and female employees, OWID.svg 850 × 600; 8 KB
-
 Average hours of work per week, by industry, OWID.svg 850 × 600; 17 KB
-
 Average hours worked per person employed, OWID.svg 850 × 600; 19 KB
-
 Average income of small-scale food producers, OWID.svg 850 × 600; 139 KB
-
 Average Income of small-scale food producers.png 3,400 × 2,400; 726 KB
-
 Average per capita supply of pulses, OWID.svg 850 × 600; 12 KB
-
 Average-farm-size (OWID 0085).png 850 × 600; 93 KB
-
 Average-farm-size-vs-gdp (OWID 0084).png 850 × 600; 75 KB
-
 Average-price-of-a-pack-of-cigarettes 2012.png 3,101 × 1,824; 491 KB
-

-
 Biomass-fish-stocks-region (OWID 0078).png 850 × 600; 81 KB
-
 Biomass-fish-stocks-taxa (OWID 0140).png 850 × 600; 62 KB
-
 Biomass-vs-abundance-taxa (OWID 0137).png 850 × 600; 65 KB
-
 Bird-populations-eu (OWID 0139).png 850 × 600; 55 KB
-
 Black rhino population, OWID.svg 850 × 600; 5 KB
-
 Borrowing to start or expand business, men vs women, OWID.svg 850 × 600; 33 KB
-
 Bottom-trawling (OWID 0138).png 850 × 600; 104 KB
-
 Bp-country-coverage (OWID 0136).png 850 × 600; 87 KB
-
-
 Breakdown of child mortality by cause, OWID.svg 850 × 600; 9 KB
-
 Breakdown of United Nations peacekeeping forces, OWID.svg 850 × 600; 7 KB
-
 Broadband subscriptions per 100 people, OWID.svg 850 × 600; 11 KB
-
 Budget-to-manage-invasive-alien-species (OWID 0135).png 850 × 600; 101 KB
-
 Burundi-Demography.png 3,400 × 2,400; 294 KB
-
 By age group- The growth of the population to 2100, OWID.svg 850 × 600; 31 KB
-
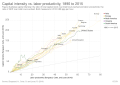 Capital intensity vs. labor productivity, OWID.svg 850 × 600; 59 KB
-
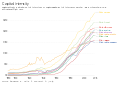 Capital intensity, OWID.svg 850 × 600; 18 KB
-
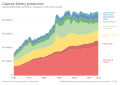 Capture fishery production, OWID.svg 850 × 600; 22 KB
-
 Capture-and-aquaculture-production (OWID 0132).png 850 × 600; 60 KB
-
 Capture-fisheries-vs-aquaculture (OWID 0131).png 850 × 600; 67 KB
-
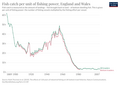 Catch-fishing-power-uk (OWID 0117).png 850 × 600; 75 KB
-
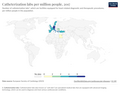 Catheterization-labs-per-million-people.png 3,400 × 2,643; 914 KB
-
 Central government expenditure as share of GDP, OWID.svg 850 × 600; 141 KB


.png)


.png)


.png)

.png)
.png)
.png)
.png)

.png)
.png)


.png)
,_OWID.svg)
,_OWID.svg)
,_OWID.svg)
,_OWID.svg)


,_1,_OWID.svg)
,_OWID.svg)
,_OWID.svg)


.png)
.png)
.png)
.png)
.png)
.png)
.png)
.png)
.png)
.png)


_vs._R%26D_expenditure_(%25_of_GDP),_OWID.svg)


.png)
.png)

.png)
.png)
.png)
.png)
.png)
.png)
.png)
.png)
.png)
.png)
.png)
.png)
.png)
.png)
.png)
.png)
.png)
.png)
.png)
.png)
.png)
.png)
.png)
.png)
.png)
.png)
.png)


.png)
,_OWID.svg)

.png)
.png)


.png)
.png)
.png)

,_OWID.svg)


,_OWID.svg)


,_OWID.svg)


),_OWID.svg)


.png)
.png)


.png)
.png)
.png)
.png)


.png)
.png)
.svg)


.png)


.png)
.png)
.png)


,_OWID.svg)
.png)
.png)