Category:Production maps of the world
Media in category "Production maps of the world"
The following 122 files are in this category, out of 122 total.
-
 2005crustacean.PNG 1,425 × 625; 58 KB
-
 2005dattes.png 1,425 × 625; 59 KB
-
 2005plywood.PNG 1,425 × 625; 58 KB
-
 2007niobium (mined).PNG 1,425 × 625; 60 KB
-
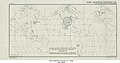
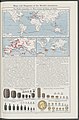
 An atlas of commercial geography (1913) (14594763908).jpg 1,676 × 2,904; 1.25 MB
-
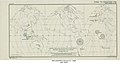
 An atlas of commercial geography (1913) (14758386396).jpg 2,384 × 2,974; 1.64 MB
-
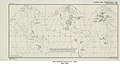
 An atlas of commercial geography (1913) (14801250363).jpg 1,626 × 1,898; 793 KB
-
 AQUACULTURE PRODUCTION (2021).svg 512 × 295; 3.71 MB
-
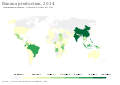 Banana production, OWID.svg 850 × 600; 140 KB
-
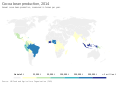
 Bean production, world map, OWID.svg 850 × 600; 154 KB
-
 Capture Fisheries And Aquaculture Production (2021).svg 512 × 295; 3.72 MB
-
 Chicken meat production, OWID.svg 850 × 600; 140 KB
-
 Cocoa bean production, OWID.svg 850 × 600; 139 KB
-
 Coffee bean production, OWID.svg 850 × 600; 140 KB
-
 Cotton textile industry in world.jpg 640 × 417; 66 KB
-
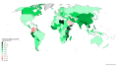
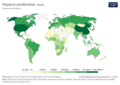
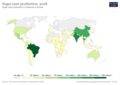
 Countries by agricultural output.PNG 1,541 × 631; 51 KB
-
 Countries by services output.PNG 1,572 × 637; 40 KB
-
 Das Kürschner-Handwerk, 3. Teil, S. 34, Herkommen der Fehfelle.jpg 2,303 × 1,949; 531 KB
-
 Diamond output2.png 800 × 351; 87 KB
-
 Diamond production, OWID.svg 850 × 600; 139 KB
-
 Domestic-material-consumption-per-capita,2017.png 3,400 × 2,400; 730 KB
-
 Fish-seafood-production (OWID 0432).png 850 × 600; 100 KB
-
 Global livestock densities map by Agtelier.jpg 2,000 × 1,333; 407 KB
-
 Gold (mined)2.png 1,425 × 625; 62 KB
-
 Habasit Worldmap.jpg 800 × 466; 45 KB
-
 Hydropower generation, OWID.svg 850 × 600; 141 KB
-
 Industrial production growth rate (%) in 2017.png 6,300 × 3,520; 2.12 MB
-
 KarteSteinkohleproduktion.png 1,357 × 628; 25 KB
-
 Location of coal miners globally.png 1,920 × 1,080; 497 KB
-
 Main manufacturer of the air transports of the heads of the state and the government.png 6,460 × 3,642; 2.01 MB
-
 Maize production, OWID.svg 850 × 600; 140 KB
-
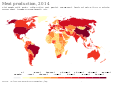 Meat production, OWID.svg 850 × 600; 142 KB
-
 Meat-production-tonnes (OWID 0662).png 850 × 600; 110 KB
-
 Milchproduktion.png 1,357 × 628; 25 KB
-
 Milk production, OWID.svg 850 × 600; 140 KB
-
 Motor vehicles produced by country 2013.png 1,568 × 757; 372 KB
-
 Motor vehicles produced by country evolution.gif 1,697 × 848; 669 KB
-
 Natural gas production (in million cubic metres) 2006.png 1,743 × 794; 125 KB
-
 Oil producing countries map-it.svg 790 × 387; 1.52 MB
-
 Oil producing countries map.PNG 1,427 × 628; 45 KB
-
 Oil producing countries map.png 1,427 × 628; 60 KB
-
 Oil producing countries.2010.png 1,427 × 628; 60 KB
-
 Oil producing USA-states-Canada-provinces map.svg 1,730 × 1,730; 218 KB
-
 Olive oil production, world map, OWID.svg 850 × 600; 156 KB
-
 OMV Upstream Jahresproduktion pro Land 2019.jpg 796 × 661; 64 KB
-
 OMVupstreamportfolio2019.png 775 × 646; 106 KB
-
 Orange production, OWID.svg 850 × 600; 140 KB
-
 Pea-production (OWID 0674).png 850 × 600; 93 KB
-
 Pigmeat production, OWID.svg 850 × 600; 141 KB
-
 Pigmeat-production-tonnes (OWID 0845).png 850 × 600; 107 KB
-
 Pigmeat-production-tonnes.png 3,400 × 2,400; 782 KB
-
 Potato production, OWID.svg 850 × 600; 140 KB
-
 Poultry production, OWID.svg 850 × 600; 141 KB
-
 Poultry-production-tonnes (OWID 0812).png 850 × 600; 104 KB
-
 Production Of Bovine Milk (2021).svg 512 × 286; 3.68 MB
-
 Production Of Cattle Meat (2021).svg 512 × 286; 3.45 MB
-
 Production Of Cereals (2021).svg 512 × 286; 3.65 MB
-
 Production Of Chicken Meat (2021).svg 512 × 286; 3.64 MB
-
 Production Of Maize (2021).svg 512 × 286; 3.63 MB
-
 Production Of Oil Palm Fruit (2021).svg 512 × 286; 3.59 MB
-
 Production Of Pig Meat (2021).svg 512 × 286; 3.65 MB
-
 Production Of Potatoes (2021).svg 512 × 286; 3.63 MB
-
 Production Of Rice (2021).svg 512 × 286; 3.61 MB
-
 Production Of Sugar Cane (2021).svg 512 × 286; 3.61 MB
-
 Production Of Wheat (2021).svg 512 × 286; 3.61 MB
-
 Rice production, OWID.svg 850 × 600; 140 KB
-
 Rye-production (OWID 0961).png 850 × 600; 92 KB
-
 Saffron crocus sativus modern world production.png 1,357 × 628; 29 KB
-
 Saffron crocus sativus production.svg 863 × 436; 1.12 MB
-
 Sesame-seed-production (OWID 0951).png 850 × 600; 90 KB
-
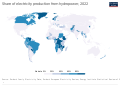 Share-electricity-hydro.svg 850 × 600; 163 KB
-
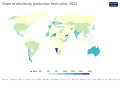 Share-electricity-solar.svg 850 × 600; 163 KB
-
 Soybean-production (OWID 1078).png 850 × 600; 96 KB
-
 Stahlproduzenten Weltkarte.png 554 × 254; 38 KB
-
 Sugar-cane-production.png 3,400 × 2,400; 705 KB
-
 Sunflower-seed-production (OWID 1067).png 850 × 600; 93 KB
-
 Sweet-potato-production (OWID 1058).png 850 × 600; 92 KB
-
 Tobacco production, OWID.svg 850 × 600; 161 KB
-
 Tomato-production (OWID 1042).png 850 × 600; 96 KB
-
 Uranium production world-ar.png 4,948 × 2,170; 911 KB
-
 Uranium production world.PNG 1,425 × 625; 59 KB
-
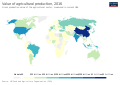 Value of agricultural production, OWID.svg 850 × 600; 161 KB
-
 Wine production, OWID.svg 850 × 600; 140 KB
-
 World Arsenic Production 2006.svg 940 × 415; 1.45 MB
-
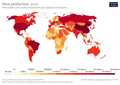
 World Lead Production 2014.svg 940 × 415; 1.45 MB
-
 World Manganese Production 2006.svg 940 × 415; 1.45 MB
-
 World map of motor vehicle production, 2000.svg 940 × 415; 1.47 MB
-
 World map of motor vehicle production, 2005.svg 940 × 415; 1.45 MB
-
 World map of motor vehicle production, 2007.svg 940 × 415; 1.45 MB
-
 World map of motor vehicle production, 2009.svg 512 × 226; 880 KB
-
 World Niobium Production 2006.svg 940 × 415; 1.45 MB
-
 World Strontium Production 2014.svg 940 × 415; 1.45 MB
-
 World Tantalum Production 2006.svg 940 × 415; 1.45 MB
-
 World Tantalum Production 2015.svg 940 × 415; 1.45 MB
-
 World- Aluminum Ore Production, 1946 - DPLA - c667460ff48f78e1c3f7f6ea88ca6f7a.jpg 6,288 × 3,359; 2.13 MB
-
 World- Cobalt Production, 1944* - DPLA - c1037ee27d2f7452509d5cade20dc8b9.jpg 6,320 × 3,323; 2.06 MB
-
 World- Copper Production, 1946 - DPLA - 1e25affd63262ebf6f714b859fa37ae6.jpg 6,312 × 3,357; 2.14 MB
-
 World- Molybdenum Production, *1946 - DPLA - bf84d1993965e3eb841cde8f2dbd4790.jpg 6,344 × 3,343; 2.13 MB
-

-
 World- Phosphate Rock Production, 1946 - DPLA - 91d47ae8aa4b189e36ea4bc9a4e3afdf.jpg 6,280 × 3,332; 2.12 MB
-
 World- Tin Production,* 1946 - DPLA - 677c4ed2e31b0634696bbc2508c3ce98.jpg 6,328 × 3,326; 2.06 MB
-
 World- Tungsten Concentrates Production* 1946 - DPLA - 04ff407662cdeca4cbc5abff7a92ce3f.jpg 6,328 × 3,324; 2.13 MB
-
 World- Vanadium Production,*1946 - DPLA - 3e24602f809408ce766ef8a40e07421c.jpg 6,296 × 3,360; 2.1 MB
-
 World- Zinc Production, 1946 - DPLA - 2f18a69219248aa357d5859b6d2cbe58.jpg 6,304 × 3,339; 2.12 MB
-
 World-Iron-Map.png 1,425 × 625; 31 KB
-
 World-Iron-Map3.png 1,425 × 625; 52 KB
-
 Worldwide meat production.pdf 1,195 × 889; 220 KB
-
 ZincMap.png 1,800 × 820; 132 KB
-
 The Harmsworth atlas and Gazetter 1908 (135852866).jpg 6,337 × 9,575; 56.37 MB
-
 The Harmsworth atlas and Gazetter 1908 (135852887).jpg 6,312 × 9,571; 55.63 MB
-
 The Harmsworth atlas and Gazetter 1908 (135852900).jpg 6,222 × 9,575; 55.11 MB
-
 The Harmsworth atlas and Gazetter 1908 (135852916).jpg 6,269 × 9,570; 52.4 MB
-
 The Harmsworth atlas and Gazetter 1908 (135852934).jpg 6,309 × 9,576; 54.98 MB
-
 The Harmsworth atlas and Gazetter 1908 (135852970).jpg 6,257 × 9,575; 52.84 MB
-
 The Harmsworth atlas and Gazetter 1908 (135852978).jpg 6,265 × 9,570; 52.67 MB
-
 The Harmsworth atlas and Gazetter 1908 (135852983).jpg 6,243 × 9,574; 50.88 MB
-
 The Harmsworth atlas and Gazetter 1908 (135852987).jpg 6,254 × 9,571; 55.29 MB
-
 The Harmsworth atlas and Gazetter 1908 (135852991).jpg 6,267 × 9,576; 50.31 MB
-
 The Harmsworth atlas and Gazetter 1908 (135852997).jpg 6,247 × 9,572; 53.95 MB
-
 The Harmsworth atlas and Gazetter 1908 (135852999).jpg 6,371 × 9,573; 53.25 MB
-
 The Harmsworth atlas and Gazetter 1908 (135853005).jpg 6,242 × 9,571; 50.36 MB
-
 The Harmsworth atlas and Gazetter 1908 (135853007).jpg 6,384 × 9,572; 52.71 MB


.PNG)
_(14594763908).jpg)
_(14758386396).jpg)
_(14801250363).jpg)
.svg)


.svg)


.png)

2.png)


_in_2017.png)


.png)


_2006.png)


.png)

.png)


.png)
.svg)
.svg)
.svg)
.svg)
.svg)
.svg)
.svg)
.svg)
.svg)
.svg)
.svg)

.png)


.png)


.png)


.png)
.png)

.png)


_-_DPLA_-_a72a168c4edb6616752aa99ff0a338ea.jpg)


.jpg)
.jpg)
.jpg)
.jpg)
.jpg)
.jpg)
.jpg)
.jpg)
.jpg)
.jpg)
.jpg)
.jpg)
.jpg)
.jpg)