Category:Rainfall amount maps of Europe
Media in category "Rainfall amount maps of Europe"
The following 86 files are in this category, out of 86 total.
-
1cpcp1 202205 europe.png 1,800 × 1,800; 659 KB
-
1cpcp1 202206 Europe.png 1,800 × 1,800; 646 KB
-
1cpcp1 202303 Europe.png 2,700 × 2,700; 993 KB
-
1cpcp1 202304 Europe.png 2,700 × 2,700; 984 KB
-
1cpcp1 202305 Europe.png 2,700 × 2,700; 1.03 MB
-
1cpcp1 202310 Europe total precipitation.png 2,700 × 2,700; 938 KB
-
1cpcp1 June 2019.png 2,700 × 2,700; 290 KB
-
1cpnp1 2022-08 Europe.png 2,700 × 2,700; 1.29 MB
-
1cpnp1 202206 Europe.png 1,800 × 1,800; 780 KB
-
1cpnp1 202303 Europe.png 2,700 × 2,700; 1.18 MB
-
1cpnp1 202304 Europe.png 2,700 × 2,700; 1.21 MB
-
1cpnp1 202305 Europe.png 2,700 × 2,700; 1.17 MB
-
1cpnp1 202308 Europe precipitation.png 2,700 × 2,700; 1.23 MB
-
1cpnp1 202310 Europe percent of normal precipitation.png 2,700 × 2,700; 1.12 MB
-
1cpnp1.png 1,800 × 1,800; 757 KB
-
2019-20 Dec-Feb CPC Europe percent of normal precipitation.png 2,700 × 2,700; 420 KB
-
2019-20 Dec-Feb CPC Europe total precipitation.png 2,700 × 2,700; 323 KB
-
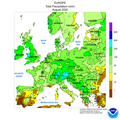
2020 August CPC Europe total precipitation.png 2,700 × 2,700; 354 KB
-
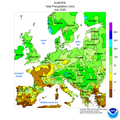
2020 July CPC Europe total precipitation.png 2,700 × 2,700; 361 KB
-
2020 March–May CPC Europe total precipitation.png 2,700 × 2,700; 311 KB
-
2020 May CPC Europe total precipitation.png 2,700 × 2,700; 349 KB
-
2020-03 CPC Europe total precipitation.png 2,700 × 2,700; 351 KB
-
2020-04 CPC Europe percent of normal precipitation.png 2,700 × 2,700; 405 KB
-
2020-04 CPC Europe total precipitation.png 2,700 × 2,700; 359 KB
-
334 of 'La France Illustrée- géographie générale ... Par F. J' (11292267583).jpg 1,271 × 1,441; 594 KB
-
36 hour rainfall totals and evidence of erosion in West Wales, 8th-9th June 2012.tif 6,704 × 4,657; 2.15 MB
-
3cpcp1 202203 202205 Europe.png 1,800 × 1,800; 562 KB
-
3cpcp1 202212-202302 Europe.png 1,800 × 1,800; 548 KB
-
3cpnp1 202203 202205 Europe.png 1,800 × 1,800; 738 KB
-
3cpnp1 202212 202302 Europe.png 1,800 × 1,800; 762 KB
-
40750bp europe precipitation annual 1.png 1,472 × 976; 1.01 MB
-
40750bp europe precipitation annual 1.svg 1,000 × 773; 4.97 MB
-
83 of 'Physiography ... New edition' (11166346706).jpg 1,417 × 2,089; 615 KB
-
Cmorph day-1 eur obs.gif 1,500 × 1,500; 92 KB
-
Deluge in greece mrg 2023249 nasa.jpg 2,798 × 1,865; 1.77 MB
-
ECDM 20230519 ST Italy Balkans.pdf 2,479 × 1,754; 1.3 MB
-
ECDM 20230811 ST Norway Sweden.pdf 2,479 × 1,752; 1.38 MB
-
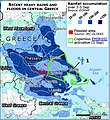
ECDM 20230906 Greece wildfires (cropped floods).jpg 841 × 919; 158 KB
-
ECDM 20231108 Southwest Europe Storm.pdf 2,479 × 1,754; 1.39 MB
-
ECDM 20240105 Western Europe(1).pdf 2,479 × 1,754; 1.6 MB
-
Flood in Central Europe 20090619-24 precip acc.png 440 × 360; 177 KB
-
Flood in Central Europe 20090619-30 precip acc.png 440 × 360; 185 KB
-
Flood in Central Europe 20090621-24 precip acc.png 440 × 360; 167 KB
-
Flood in Central Europe 20090625-30 precip acc.png 440 × 360; 182 KB
-
Flood in Central Europe 20090701-09 precip acc.png 440 × 360; 177 KB
-
NIMH 24h Rainfall Bulgaria June19 2014.jpg 792 × 503; 85 KB
-
NWS-NOAA Europe Percentage of Normal Precipitation DEC 30, 2018 - JAN 5, 2019.png 2,700 × 2,700; 230 KB
-
NWS-NOAA Europe Percentage of Normal Precipitation JAN 13 - 19, 2019.png 2,700 × 2,700; 313 KB
-
NWS-NOAA Europe Percentage of Normal Precipitation JAN 6 - 12, 2019.png 2,700 × 2,700; 304 KB
-
NWS-NOAA Europe Percentage of Normal Precipitation NOV 2014 cropped.png 1,812 × 1,243; 171 KB
-
NWS-NOAA Europe Percentage of Normal Precipitation NOV 2014.png 2,434 × 2,488; 325 KB
-
NWS-NOAA Europe Total Percipitation MAY 11-17, 2014.png 2,400 × 2,250; 217 KB
-
NWS-NOAA Europe Total Percipitation NOV 2-8, 2014.png 2,425 × 2,485; 286 KB
-
NWS-NOAA Europe Total Percipitation NOV 2014.png 2,428 × 2,488; 289 KB
-
NWS-NOAA Europe Total Percipitation NOV 30-DEZ 6, 2014.png 2,431 × 2,485; 280 KB
-
NWS-NOAA Europe Total Percipitation NOV 9-15, 2014.png 2,425 × 2,488; 288 KB
-
NWS-NOAA Europe Total precipitation JAN 1 - 7, 2017.png 2,700 × 2,700; 286 KB
-
NWS-NOAA Europe Total precipitation JAN 15 - 21, 2017.png 2,700 × 2,700; 303 KB
-
NWS-NOAA Europe Total precipitation JAN 22 - 28, 2017.png 2,700 × 2,700; 280 KB
-
NWS-NOAA Europe Total precipitation JAN 29 - FEB 4, 2017.png 2,700 × 2,700; 304 KB
-
NWS-NOAA Europe Total precipitation JAN 8 - 14, 2017.png 2,700 × 2,700; 305 KB
-
Pcpns 20220731 20220806 Europe.png 2,700 × 2,700; 980 KB
-
Pcpns anomaly in July 2002 in Europe.png 2,700 × 2,700; 1.17 MB
-
Precipitation normal Norway.jpg 400 × 800; 43 KB
-
Rainfall in England and Wales, 1911.jpg 1,415 × 2,259; 366 KB
-
Rainfall map over the British Isles for the period 2015-11-30 to 2015-12-07.jpg 1,280 × 720; 1.24 MB
-
Roczna suma opadów.png 4,961 × 4,961; 8.14 MB
-
Spain rainfall mrg 20231029-20241104.jpg 720 × 545; 253 KB
-
Wcpcp1 20220710 20220716 Europe.png 1,800 × 1,800; 541 KB
-
Wcpcp1 20230416-20230422 Europe.png 1,800 × 1,800; 540 KB
-
Wcpcp1 20230507-20230513 Europe.png 1,800 × 1,800; 570 KB
-
Wcpcp1 20230514-20230520 Europe.png 2,700 × 2,700; 998 KB
-
Wcpcp1 20230702-20230708 Europe.png 2,700 × 2,700; 1,018 KB
-
Wcpcp1 20230709-20230715 Europe total precipitation.png 1,800 × 1,800; 585 KB
-
Wcpcp1 20230716-20230722 Europe total precipitation.png 1,800 × 1,800; 581 KB
-
Wcpcp1 20230723-20230729 Europe total precipitation.png 1,800 × 1,800; 593 KB
-
Wcpcp1 20230813-20230819 Europe total precipitation.png 1,800 × 1,800; 595 KB
-
Wcpcp1 20230903-20230909 Europe total precipitation.png 2,700 × 2,700; 893 KB
-
Wcpcp1 20230924-20230930 Europe total precipitation.png 2,700 × 2,700; 928 KB


