Category:Renewable energy statistics for the United States
Media in category "Renewable energy statistics for the United States"
The following 49 files are in this category, out of 49 total.
-
 10 YR Profile of Renewables Electric Energy Generation in US.png 507 × 338; 15 KB
-
 10 yr Profile of Wind Generated Electric Energy.jpg 480 × 289; 30 KB
-
 1776 Historical energy consumption - U.S. - EIA data.svg 1,200 × 675; 6 KB
-
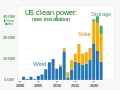 2000- Clean power installation - wind, solar, storage - US.svg 1,000 × 750; 3 KB
-
 2004-2014 Renewable Electric Energy profile.png 528 × 355; 15 KB
-

-
 2005-2016 Renewable Electric Energy Profile.jpg 476 × 296; 37 KB
-
 2014 Contributions by Renewables to US Total Energy (11-).png 384 × 350; 15 KB
-
 2014 Geo Thermal Electric Energy Generation Profile.png 504 × 342; 10 KB
-
 2014 Wind Electric Energy Generation Profile.png 504 × 342; 11 KB
-
 2015 Other Biomass Electric Energy Generation Profile.png 507 × 338; 12 KB
-
 2015 Renewable Electric Energy Generation.png 481 × 288; 13 KB
-
 2015 Top Five Hydro States.png 481 × 288; 8 KB
-
 2015 Top Five States for Renewable Electric Energy.png 481 × 288; 7 KB
-
 2015 Top Five Wind States.png 481 × 288; 9 KB
-
 2015 US Renewables Pie Chart.png 363 × 338; 13 KB
-
 2015 Wood Electric Energy Generation Profile.png 507 × 338; 12 KB
-
 2015-2019 Capacity Projections.png 507 × 338; 11 KB
-
 2016 Profile of Renewable Electric Energy.jpg 480 × 289; 41 KB
-
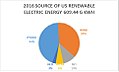 2016 Source of US Renewable Electric Energy 609.44.jpg 481 × 289; 23 KB
-
 2016 Top Five States for Renewable Electric Energy.png 480 × 289; 7 KB
-
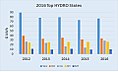 2016 Top HYDRO States.jpg 480 × 289; 31 KB
-
 2018 State Geothermal Electric Generation.jpg 483 × 292; 20 KB
-
 2018 State Hydro Electric Generation.jpg 483 × 409; 33 KB
-
 2018 State Renewable Electric Generation.jpg 483 × 775; 59 KB
-
 2018 State Utility Solar Electric Generation.jpg 483 × 387; 30 KB
-
 2018 Top Ten States Biomass.jpg 483 × 292; 32 KB
-
 2018 Top Ten States Geothermal.jpg 483 × 292; 25 KB
-
 2018 Top Ten States Hydro.jpg 483 × 306; 27 KB
-
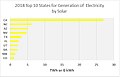 2018 Top Ten States Solar.jpg 483 × 309; 25 KB
-
 2018 Top Ten States Wind.jpg 483 × 302; 29 KB
-

-
 20220314 Renewable electricity generation - United States.svg 1,075 × 750; 7 KB
-
 Monthly US Hydro Profile 2015.png 507 × 338; 11 KB
-
 Projected US Renewable Electric Capacity.jpg 500 × 466; 68 KB
-
 Renewable Electric Energy 10yr Actual 5yr predicted.png 509 × 370; 14 KB
-
 Renewable Electric Energy 2004-2015 Actual 2016-2019 Projected.png 548 × 375; 17 KB
-
 Renewable Electric Energy Profile.png 482 × 334; 13 KB
-
 Renewable Electricity Production in the United States.svg 750 × 560; 28 KB
-
 Renewable energy production in California.svg 750 × 560; 14 KB
-
-
 Sources of Total US Renewable Energy.png 2,265 × 2,371; 36 KB
-
 Timeline of electricity from renewable sources in the United States.png 2,487 × 1,361; 129 KB
-
 United States Renewable Generation from EIA AEO 2014.png 1,024 × 768; 30 KB
-
 US annual increase in renewable energy AEO 2015.png 1,024 × 768; 39 KB
-
 US Electricity from renewables.png 566 × 315; 27 KB
-
 US monthly renewable electricity generation.png 1,024 × 768; 90 KB
-
 US Percent of Energy Exported-Projected-2050.png 1,600 × 400; 43 KB
-
 US Renewable Electricity by Source.png 1,350 × 1,575; 27 KB


.png)


.png)


