Category:SVG cell biology
Subcategories
This category has the following 11 subcategories, out of 11 total.
Media in category "SVG cell biology"
The following 118 files are in this category, out of 118 total.
-
 Anisogamy.svg 262 × 618; 9 KB
-
 Antibody structure.svg 729 × 919; 28 KB
-
 B cell activation-ru.svg 662 × 869; 44 KB
-
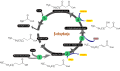 Beta oksydacja.svg 1,195 × 703; 105 KB
-
 Bilayer hydration profile-es.svg 648 × 634; 389 KB
-
 Bilayer hydration profile.svg 648 × 634; 355 KB
-
 Binary fission.svg 225 × 460; 24 KB
-
 Binary fission2.svg 422 × 888; 79 KB
-
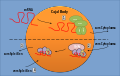 Cajal-Body-Detail.svg 1,134 × 720; 253 KB
-
 Cajal-Body-Overview.svg 1,134 × 720; 132 KB
-
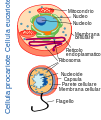 CellulaEucarioteProcariote.svg 270 × 320; 86 KB
-
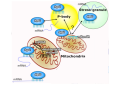
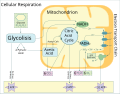 Cellular respiration EN.svg 865 × 677; 1.03 MB
-
 Cellular respiration FR.svg 865 × 677; 1.03 MB
-
 Complement alternative.svg 2,001 × 394; 582 KB
-
 Complement leclassic.svg 2,028 × 628; 987 KB
-
 Complex of TCR.svg 2,070 × 1,601; 210 KB
-
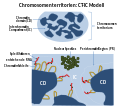 CT-IC-Modell-DE.svg 960 × 869; 342 KB
-
 Cyanogene Glukoside-fr.svg 600 × 350; 42 KB
-
 Cyanogene Glukoside.svg 600 × 350; 41 KB
-
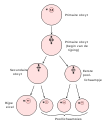
 Cykl życiowy komórki,4 fazy.svg 749 × 409; 16 KB
-
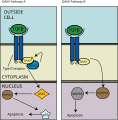 DAXX Pathway.svg 312 × 317; 13 KB
-
 Débit de Filtration Glomérulaire.svg 512 × 307; 306 KB
-
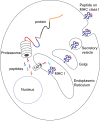
 Endomembrane system diagram en (edit) gl.svg 612 × 486; 91 KB
-
 Endosymbiotic theory.svg 512 × 384; 452 KB
-
 Eventi principali della mitosi.svg 1,023 × 372; 11 KB
-
 Evolución eucariota.svg 744 × 1,052; 397 KB
-
 Exocytosis types.svg 399 × 349; 90 KB
-
 Exosome formation - ru.svg 885 × 525; 700 KB
-
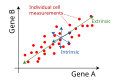 Extrinsic and intrinsic noise in cellular biology.svg 300 × 206; 6 KB
-
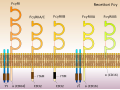 Fc receptors.svg 2,080 × 1,543; 244 KB
-
 Filmstreifen Meiose.svg 512 × 2,501; 82 KB
-
 Filmstreifen Mitose.svg 512 × 2,501; 38 KB
-
 Frap diagram.svg 604 × 956; 488 KB
-
 Gray5 - es.svg 658 × 768; 34 KB
-
 Gray5 de.svg 658 × 768; 15 KB
-
 Gray5 nl.svg 658 × 768; 16 KB
-
 Gray5-ja.svg 658 × 768; 123 KB
-
 Gray5.svg 658 × 768; 9 KB
-
 Hauptereignisse der Mitose.svg 1,023 × 372; 11 KB
-
 How Obesity Could Lead To Cancer.svg 610 × 750; 30 KB
-
 HR in meiosis-tr.svg 1,000 × 1,500; 168 KB
-
 HR schematic diagram-tr.svg 650 × 850; 48 KB
-
 HR schematic diagram.svg 650 × 850; 49 KB
-
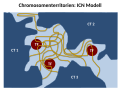 ICN-Modell-DE.svg 960 × 720; 128 KB
-
 Ig domains.svg 577 × 947; 17 KB
-
 Ig genic domains.svg 460 × 1,457; 27 KB
-
 Immune complex.svg 794 × 711; 14 KB
-
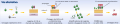
 Induction of iPS cells.svg 840 × 420; 12 KB
-
 Inflammasome - ru.svg 818 × 841; 149 KB
-
 Innate Immune cells - ru.svg 553 × 1,179; 83 KB
-
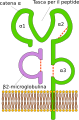
 Intermediate filament-fr.svg 367 × 175; 40 KB
-
 Intermediate filament-HE.svg 367 × 175; 42 KB
-
 Intermediate filament.svg 367 × 175; 40 KB
-
 Isogamy.svg 267 × 600; 15 KB
-
 Karyogenesis.svg 200 × 600; 22 KB
-
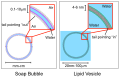 Lipid vesicle vs soap bubble.svg 734 × 475; 1.18 MB
-
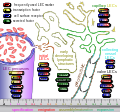 Lymphatic molecules.svg 881 × 819; 1,002 KB
-
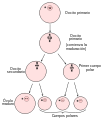
 Macrospore-formation-fr.svg 767 × 442; 26 KB
-
 Macrospore-formation.svg 767 × 442; 26 KB
-
 Main protein structure levels ku.svg 434 × 757; 230 KB
-
 Mechanisms of entosis and entotic cell death-ru.svg 512 × 358; 10 KB
-
 Meiosi.svg 460 × 289; 46 KB
-
 Meiosis Overview.svg 512 × 300; 31 KB
-
 Membrane potential ions en.svg 550 × 400; 185 KB
-
 Membrane potential ions-ru.svg 550 × 400; 186 KB
-
 MHC Class I processing.svg 493 × 594; 210 KB
-
 MHC-I structure.svg 656 × 996; 121 KB
-
 MHC-II structure.svg 370 × 620; 117 KB
-
 Micelle scheme2-en.svg 562 × 433; 24 KB
-
 Microspore-formation-fr.svg 767 × 442; 39 KB
-
 Microspore-formation.svg 767 × 442; 39 KB
-
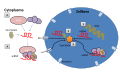
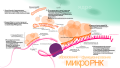 MiRNA - ru.svg 2,181 × 1,226; 740 KB
-
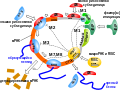 MiRNA mechanisms - ru.svg 2,959 × 2,213; 71 KB
-
 Mitochondrion structure gl.svg 1,000 × 700; 128 KB
-
 Mitomir 1.svg 1,052 × 744; 524 KB
-
 Modelling stochastic gene expression.svg 496 × 157; 3 KB
-
 Neural.crest.cells.migration.svg 580 × 649; 50 KB
-
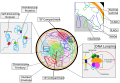 Nuclear Architecture.svg 835 × 576; 73 KB
-
 NuclearSpeckle-Splicing.svg 832 × 720; 587 KB
-
 Oddychanie komórkowe.svg 1,147 × 755; 15 KB
-
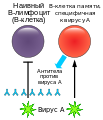 Original antigenic sin - ru.svg 253 × 294; 110 KB
-
 P90Rsk.svg 1,364 × 1,860; 501 KB
-
 Paraspeckle-Aufbau.svg 960 × 720; 634 KB
-
 Paraspeckle-Bildung.svg 960 × 720; 564 KB
-
 Paraspeckle-Ctn.svg 960 × 720; 37 KB
-
 PML-Bildung.svg 960 × 720; 324 KB
-
 PML-Funktionen.svg 1,021 × 720; 93 KB
-

-
 Processus de régénération du muscle strié squelettique.svg 2,048 × 2,042; 485 KB
-
 Pyroptosis mechanism - ru.svg 863 × 776; 281 KB
-
 RecombinationIg mechanism.svg 997 × 2,616; 148 KB
-
 Regulación glucolisis.svg 729 × 821; 30 KB
-
 Regulation-Genexpression-NucelarSpeckle.svg 960 × 720; 126 KB
-
 Renal corpuscle.svg 1,030 × 760; 535 KB
-
 Riechschleimhaut.svg 1,500 × 750; 60 KB
-
 Rnai diagram retrovirology - ru.svg 1,186 × 1,158; 60 KB
-
 ROCK protein function.svg 737 × 393; 43 KB
-
 Rsk domains.svg 930 × 180; 148 KB
-
 Scheme of apoptosis Polish language version.svg 1,082 × 773; 172 KB
-
 Seccion undulipodio.svg 744 × 744; 252 KB
-
 Semnalizare engl.svg 1,052 × 744; 22 KB
-
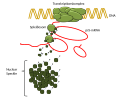
 Signal sequence.svg 620 × 148; 33 KB
-
 T cell activation - ru.svg 519 × 744; 68 KB
-
 T2SS.svg 429 × 362; 122 KB
-
 TCellReceptor.svg 336 × 558; 49 KB
-
 TCR genic domains.svg 734 × 1,043; 25 KB
-
 The development and the ways to rejuvenate cells - en.svg 2,339 × 1,629; 871 KB
-
 The development and the ways to rejuvenate cells - ru.svg 2,339 × 1,629; 881 KB
-
 TrasductionAP1B.svg 2,345 × 392; 1.11 MB
-
 TrasductionAP1T.svg 2,440 × 409; 1.27 MB
-
 TrasductionIP3.svg 1,315 × 357; 337 KB
-
 Turgid-ms.svg 477 × 278; 42 KB
-
 Turgid.svg 477 × 278; 42 KB
-
 Turgor pressure on plant cells diagram.svg 618 × 244; 40 KB
-
 Zellatmung-uebersicht.svg 736 × 697; 36 KB
-
 Zellzyklus-NuclearSpeckles.svg 832 × 454; 82 KB
-
 Тельце Кахаля.svg 800 × 660; 278 KB
-
 減数分裂 DNA量の変化.svg 3,300 × 800; 125 KB


_gl.svg)


