Category:SVG line charts
Media in category "SVG line charts"
The following 200 files are in this category, out of 292 total.
(previous page) (next page)-

-

-

-

-

-

-

-

-

-

-

-
 100 Women Days 2023–24 Artikel je Tag.svg 709 × 319; 36 KB
-
 100 Women Days 2023–24 Durchschnitt.svg 709 × 319; 37 KB
-
 100 Women Days 2023–24 Gesamtzahl.svg 709 × 319; 38 KB
-

-

-

-
 1800- Global carbon dioxide emissions, per person.svg 1,200 × 675; 6 KB
-
 1850- Annual emissions of carbon dioxide, by country.svg 1,200 × 675; 20 KB
-
 1850- Cumulative emissions of carbon dioxide, by country.svg 1,200 × 675; 17 KB
-
 1880- Global average sea level rise (SLR) - annually.svg 1,200 × 675; 6 KB
-
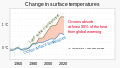
 1880- Global average sea surface temperature - global warming.svg 1,200 × 900; 8 KB
-
 1900-2300 Long-term projections of sea level rise.svg 1,200 × 675; 5 KB
-
 1907- Income inequality and union participation.svg 1,000 × 750; 8 KB
-
 1910- Fertility rate - United States.svg 1,200 × 675; 4 KB
-

-

-
 1951+ Percent of global area at temperature records - Seasonal comparison - NOAA.svg 2,000 × 1,400; 22 KB
-

-
 1953- Funding for research and development - US.svg 1,000 × 750; 6 KB
-
 1960- Groundwater loss - depletion - Central Valley of California.svg 1,200 × 675; 4 KB
-
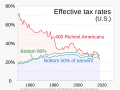 1960- Tax rates of richest versus low income people - US.svg 1,000 × 750; 6 KB
-

-

-
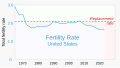 1965- Fertility rate - United States.svg 1,200 × 675; 7 KB
-

-
 1970- Decline in species populations - Living Planet Index.svg 1,200 × 675; 7 KB
-
-
 1990- Annual greenhouse gas emissions - U.S. - line chart.svg 1,200 × 675; 5 KB
-
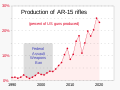 1990- AR-15 production as percentage of guns produced in US.svg 1,000 × 750; 4 KB
-
 1990- Renewable energy production, by source cs.svg 1,000 × 750; 5 KB
-
 1990- Renewable energy production, by source.svg 1,000 × 750; 5 KB
-
 1994- Motor vehicle traffic deaths in road accidents, by country.svg 1,000 × 750; 6 KB
-
 1997- Bowling centers, league members, and lanes - normalized.svg 1,000 × 750; 3 KB
-
 1997- Bowling centers, league members, and lanes - raw numbers.svg 1,000 × 750; 3 KB
-
 1997- Lanes per bowling center.svg 1,000 × 750; 2 KB
-
 2000- Gun sales and NICS firearm background checks - U.S.svg 1,000 × 750; 6 KB
-
 2004- "Climate change" as a search term - Google trends.svg 1,000 × 750; 14 KB
-

-
 2010- Cost of renewable energy - IRENA.svg 1,000 × 750; 8 KB
-
 2010- Fossil fuels vs Wind + Solar - electricity generation.svg 859 × 750; 8 KB
-

-
 2012 meningitis cases.svg 1,800 × 1,200; 12 KB
-
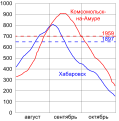 2013 Khabarovsk and Komsomolsk-na-Amure flood chart.svg 435 × 439; 116 KB
-
 2015- Clean energy vs fossil fuel investment - IEA.svg 1,000 × 750; 3 KB
-

-
 20200101 Life expectancy increases with age already achieved - chart.svg 1,000 × 750; 9 KB
-
 20200101 Remaining life expectancy - US.svg 1,000 × 750; 9 KB
-

-
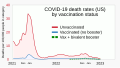 2021- COVID-19 death rates by vaccination status - US.svg 1,200 × 675; 7 KB
-

-
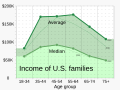 2022 Average and median family income, by age - US.svg 1,000 × 750; 3 KB
-
 2022 Average and median family net worth, by age - US.svg 1,000 × 750; 3 KB
-
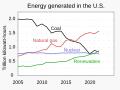 20221231 Energy generation in the United States - Rhodium Group.svg 1,000 × 750; 3 KB
-
 202303 I worry "a great deal" about climate change - Gallup survey.svg 1,000 × 750; 5 KB
-

-
 20230516 Toxic positivity - Google Trends search term history.svg 1,200 × 675; 6 KB
-
 20230703 Average speed of bowling ball versus travel time.svg 1,000 × 750; 3 KB
-
-
 20240524 Trump groundwork for election denial.svg 1,000 × 750; 5 KB
-
 20240625 Global warming across generations - warming stripes.svg 1,200 × 1,090; 20 KB
-
 Absorption spectra of monolayer graphene nanoribbons.svg 595 × 842; 188 KB
-
 Admins by reg date 2016.svg 540 × 360; 37 KB
-
 Allowing military service for LGBT.svg 450 × 316; 66 KB
-
 Altitude decay of Mir.svg 1,920 × 1,080; 5.92 MB
-
 Ammonium nitrate water phase diagram.svg 690 × 496; 842 KB
-
 Angle de vision et coefficient de réflexion.svg 566 × 562; 19 KB
-
 Arbeitslosenentwicklung 1933.svg 1,024 × 585; 883 KB
-
 Arbeitslosigkeit im Reich.svg 1,020 × 600; 321 KB
-
 Arccos, cos, and identity.svg 436 × 284; 26 KB
-
 AreaDistributionCountries.svg 623 × 405; 79 KB
-
 Arkansas-electricity-generation-1990-2012.svg 454 × 255; 258 KB
-
 Atmospheric sound absorption coefficient.svg 512 × 384; 75 KB
-
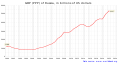
 Audience annuelle - TVA.svg 600 × 400; 28 KB
-
-
 Audience trimestrielle - ICI Radio-Canada Télé.svg 600 × 400; 26 KB
-
 Australian Population 1788 - 2007 (log scale).svg 512 × 512; 21 KB
-
 Australian Population 1788 - 2007.svg 512 × 512; 21 KB
-
 Australian Population growth rate 1792-1860.svg 512 × 512; 32 KB
-
 Australian Population growth rate 1860-2007.svg 512 × 512; 36 KB
-
 Babamın Sesi izlenme.svg 512 × 376; 14 KB
-
 BaeckereiMedian.svg 2,759 × 2,200; 34 KB
-
 Bar2e.png 321 × 223; 6 KB
-
 Betreuungsmittelwert HessKifoeg 25c 2014.svg 800 × 650; 203 KB
-
 Bevölkerungsentwicklung Helsinki 1875-2018.svg 799 × 403; 86 KB
-
-

-

-
 Body mass index simplified.svg 429 × 425; 48 KB
-
 Brachios vs bivalves fossil record.svg 800 × 340; 24 KB
-
 Bracketing pairs.svg 306 × 212; 4 KB
-
 Brendan - male given name - birth pop USA SS.svg 937 × 469; 38 KB
-
 Brendon - male given name - birth pop USA SS.svg 937 × 469; 36 KB
-
 Burnoutvel-eng.svg 1,200 × 1,000; 112 KB
-
 Cdf-ecdf.svg 554 × 424; 42 KB
-
 Chandra2.svg 724 × 600; 49 KB
-
 Change of the operating kilometers of Kintetsu, Tōbu and Meitetsu.svg 1,036 × 730; 265 KB
-
 Changes in US Money supply.svg 720 × 540; 48 KB
-
 Chart - Russia for Russians (1998-2011).svg 1,340 × 745; 28 KB
-
 Chart of US Top 1% Income Share (1913-2008).svg 999 × 713; 41 KB
-
 Charts SVG Example 11 - Stacked Line Chart.svg 692 × 395; 6 KB
-
 Charts SVG Example 15 - Text and Layout Adjustments.svg 576 × 463; 7 KB
-
 Charts SVG Example 16 - Axis Adjustments.svg 692 × 401; 7 KB
-
 Charts SVG Example 2 - Simple Line Chart.svg 692 × 401; 6 KB
-
 Charts SVG Example 7 - Grouped Line Chart.svg 692 × 395; 6 KB
-
 Components of US Money supply (logscale).svg 720 × 540; 90 KB
-
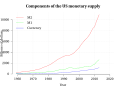 Components of US Money supply.svg 720 × 540; 57 KB
-
 Composite Index of National Capability.svg 617 × 356; 20 KB
-
 Computer-go-ratings-English.svg 493 × 347; 7 KB
-
 Computer-go-ratings-Polish.svg 493 × 347; 7 KB
-
 Cours de l'indice ATX depuis 1986.svg 600 × 400; 116 KB
-
 Crude oil spread.svg 825 × 300; 57 KB
-
 CyclingPowerComponents.svg 1,053 × 744; 38 KB
-
 Czech election opinion polling chart.svg 1,208 × 702; 138 KB
-
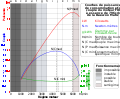 Daewoo Matiz F8C motor curves and functional zones-fr.svg 1,150 × 950; 41 KB
-
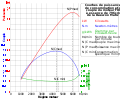 Daewoo Matiz F8C power, consumption and torque-fr.svg 1,150 × 950; 28 KB
-
 Daewoo Matiz F8C power, consumption and torque-hu.svg 1,145 × 948; 31 KB
-
 Daewoo Matiz F8C wykresy mocy momentu i zużycia paliwa.svg 1,209 × 985; 39 KB
-
 Daily Tumblr posts by year.svg 567 × 319; 12 KB
-
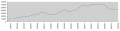 Deletions per month.svg 567 × 145; 16 KB
-
 Deletions per second.svg 565 × 130; 13 KB
-
 Detroit population and rank.svg 500 × 425; 9 KB
-
 Devils-staircase.svg 480 × 480; 11 KB
-
 Disneyland Park Adult Admission.svg 854 × 620; 64 KB
-
 Disp bouss.svg 720 × 450; 33 KB
-
 DMAX market share 2006 to 2014 (de).svg 774 × 517; 67 KB
-
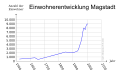 Einwohner Magstadt.svg 800 × 500; 153 KB
-
 Entwicklung Erwerbstätige Arbeitsvolumen Vollzeitäquivalente D.svg 985 × 733; 22 KB
-
 Entwicklung Realohn Nominallohn Verbraucherpreisindex D.svg 768 × 432; 64 KB
-
 ESPI out-of-plane.svg 454 × 306; 12 KB
-
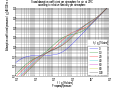
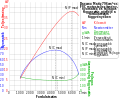
 Estimations of Human Brain Emulation Required Performance.svg 800 × 600; 49 KB
-
 Etudiant superieur france.svg 512 × 410; 14 KB
-
 Euro opinion Denmark.svg 600 × 300; 52 KB
-
 Europe top 10 wind power capacity per capita.svg 4,751 × 2,985; 21 KB
-
 Eurostar market shares.svg 577 × 328; 182 KB
-
 EverestAscents.svg 1,300 × 975; 11 KB
-
 Evolución del salario mínimo de Brasil 1990-2008.svg 600 × 480; 21 KB
-
 Existing home sales chart.svg 552 × 227; 25 KB
-
 Expected value continuous pdf 001.svg 680 × 450; 6 KB
-
 Extragrundavdrag.svg 1,053 × 744; 12 KB
-
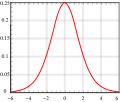
 E^(-x^2).svg 600 × 480; 37 KB
-
 Fa derivative11.svg 512 × 414; 17 KB
-

-
 Federal Budget (1990-2000).svg 600 × 400; 21 KB
-
 Fildertunnelgradiente2.svg 663 × 471; 18 KB
-
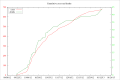
 Firefox growth cumulative.svg 600 × 400; 3 KB
-
 Firefox usage data.svg 650 × 400; 7 KB
-
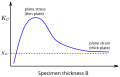 Fracture Toughness Thickness Dependence.svg 964 × 619; 11 KB
-
 FWHM 1.svg 512 × 410; 26 KB
-
 G2hkhiv.svg 1,200 × 800; 480 KB
-
 Gartenlaube Verteilung Anzahl Artikel je Autor und Jahre.svg 512 × 512; 58 KB
-
 GDP BRICS G7.svg 1,100 × 480; 5 KB
-
 GDP PPP per capita CIS.svg 1,130 × 550; 13 KB
-
 GDP PPP Poland.svg 1,130 × 550; 23 KB
-
 GDP PPP Russia.svg 1,130 × 590; 6 KB
-
 GDP PPP Ukraine.svg 1,000 × 450; 4 KB
-
 GDP PPP USA China.svg 1,200 × 500; 10 KB
-
 Gen-Con-Attendance.svg 600 × 480; 18 KB
-
 Geschenkökonomie.svg 697 × 504; 5 KB
-
 Gew obj.svg 1,238 × 703; 156 KB
-
 Gold-nominal-constant-usd.svg 2,311 × 1,419; 1.87 MB
-
 Goodison-park-average-attendance.svg 1,400 × 450; 6 KB
-
 Grade slope.svg 288 × 288; 8 KB
-
 Graph of RfA Ratio over time.svg 1,155 × 585; 12 KB
-
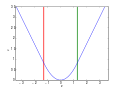
 Graph of x squared undefined at x equals 2.svg 450 × 450; 25 KB
-
 Graph.svg 300 × 310; 84 KB
-
 Half-age-plus-seven-relationship-rule.svg 755 × 798; 137 KB
-
 HDI Ukraine.svg 1,000 × 490; 4 KB
-
 Hemline (skirt height) overview chart 1805-2005.svg 1,180 × 590; 2 KB
-
 Historical-cost-of-computer-memory-and-storage OWID.svg 850 × 600; 26 KB
-
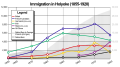 Holyoke Immigration (1855-1920).svg 606 × 339; 244 KB
-
 Homew2 1.svg 571 × 518; 4 KB
-
 Hubbert curve.svg 512 × 435; 2 KB
-
 Huber k rho function.svg 526 × 394; 24 KB
-
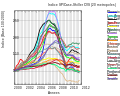 Indice case shiller october 2011 all.svg 512 × 410; 68 KB
-
 Indice case shiller october 2011.svg 512 × 410; 27 KB
-
 Indiferentzia-kurba 01.svg 217 × 217; 7 KB
-
 Iran internet users per 100 person.svg 512 × 336; 22 KB
-
 Kernel logistic.svg 600 × 480; 7 KB
-
 Kernel Silverman.svg 600 × 480; 8 KB
-
 Klimadiagramm Aachen.svg 600 × 600; 243 KB
-
 Km plot.svg 480 × 320; 3 KB
-
 Lebende Mondbesucher.svg 600 × 371; 58 KB
-
 Les sans pagEs - created articles per month.svg 646 × 399; 119 KB
-
 Liniendiagramm-Beispiel.svg 500 × 400; 15 KB
-
 Live birth rates by TMSC.svg 255 × 165; 21 KB
-
 Living People Watchlist Histogram.svg 540 × 360; 48 KB
-
 Livraisons d'Airbus et Boeing depuis 1989.svg 600 × 400; 25 KB
-
 LogLog exponentials.svg 512 × 512; 12 KB
-
 LOST TV show US viewership ratings fr.svg 812 × 603; 15 KB


.svg)


_-_annually.svg)


_-_Global_warming_-_NOAA.svg)

_-_Global_warming.svg)


.svg)

.svg)


.svg)
.svg)


.svg)


.svg)


.svg)


.svg)


_overview_chart_1805-2005.svg)

.svg)


