Category:SVG maps by Allice Hunter
Subcategories
This category has only the following subcategory.
Media in category "SVG maps by Allice Hunter"
The following 183 files are in this category, out of 183 total.
-
 2018 UN Human Development Report (inequality-adjusted).svg 512 × 230; 767 KB
-
 2018 UN Human Development Report.svg 512 × 230; 767 KB
-
 2019 UN Human Development Report (inequality-adjusted).svg 512 × 230; 810 KB
-
 2019 UN Human Development Report.svg 512 × 230; 799 KB
-
 2020 UN Human Development Report (inequality-adjusted).svg 2,192 × 1,135; 1.62 MB
-
 2020 UN Human Development Report.svg 2,192 × 1,135; 1.62 MB
-
 2021-22 UN Human Development Report (inequality-adjusted).svg 2,192 × 1,135; 1.64 MB
-
 2021-22 UN Human Development Report (multicolor).svg 2,192 × 1,135; 1.64 MB
-
 2021-22 UN Human Development Report.svg 2,192 × 1,135; 1.64 MB
-
 Administrative divisions of China by HDI (2017).svg 512 × 427; 122 KB
-
 Administrative divisions of China by HDI (2019).svg 512 × 427; 115 KB
-
 Anglospeak (subnational version).svg 2,437 × 1,064; 856 KB
-
 Angolan provinces by HDI (2017).svg 512 × 546; 134 KB
-
 Armenian provinces by HDI (2017).svg 512 × 523; 83 KB
-
 Australian states by GSP (2018–19).svg 512 × 469; 58 KB
-
 Australian states by GSP per capita (2018–19).svg 512 × 469; 58 KB
-
 Australian states by HDI (2017).svg 512 × 469; 60 KB
-
 Austrian states by HDI (2017).svg 512 × 278; 72 KB
-
 Belgian provinces by HDI (2017).svg 512 × 448; 142 KB
-
 Blank map of the Portuguese regions.svg 721 × 1,122; 149 KB
-
 Bolivian departments by HDI (2017).svg 512 × 584; 190 KB
-
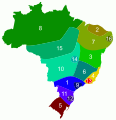
 Brazilian states by HDI (2017).svg 512 × 521; 203 KB
-
 Brazilian States by Population (2018).svg 774 × 872; 247 KB
-
 Can provinces and territories by population in 2016.svg 1,337 × 1,358; 149 KB
-
 Canada Location Map (2017) with Yellowknife and Saskatoon.svg 512 × 512; 2.46 MB
-
 Canadian provinces and territories by GDP (2021).svg 1,114 × 942; 232 KB
-
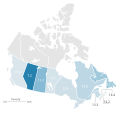
 Canadian provinces and territories by HDI (2015).svg 512 × 493; 103 KB
-
 Canadian provinces and territories by HDI (2018).svg 512 × 493; 91 KB
-
 Canadian provinces and territories by HDI (2019).svg 512 × 493; 48 KB
-
 Capitais do Brasil por IFDM (2018).svg 916 × 890; 506 KB
-
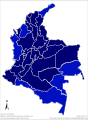 Colombian departments by HDI (2017).svg 512 × 697; 354 KB
-
 Counties of Croatia by HDI (2018).svg 512 × 514; 254 KB
-

-
 Countries with Very High HDI in the 2019 Human Development Index Report.svg 2,192 × 1,135; 1.64 MB
-
 Districts of Pakistan by HDI (2015).svg 512 × 480; 93 KB
-
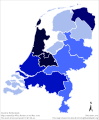 Dutch provinces by HDI (2017).svg 512 × 621; 102 KB
-
 Ecuadorian provinces by HDI (2017).svg 512 × 614; 242 KB
-
 Estados brasileiros por expectativa de vida (2020).svg 767 × 763; 167 KB
-
 Estados brasileiros por incidência da pobreza (2021).svg 767 × 763; 167 KB
-
 Estados brasileiros por índice de transparência (2022).svg 767 × 763; 226 KB
-
 European countries by GDP nominal (2020).svg 680 × 520; 622 KB
-
 European countries by GDP nominal per capita (2020).svg 680 × 520; 642 KB
-
 European countries by GDP nominal per capita (2021).svg 680 × 520; 642 KB
-
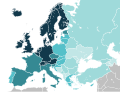 European countries by HDI (2019).svg 680 × 520; 621 KB
-
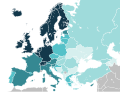 European countries by HDI (2021).svg 680 × 520; 649 KB
-
 European countries by life expectancy (2020).svg 680 × 520; 649 KB
-
 European countries by population (2020-2022).svg 680 × 520; 649 KB
-
 European countries by population growth rate (2021).svg 680 × 520; 649 KB
-
 European countries by population growth rate (2022).svg 680 × 520; 649 KB
-
 FAO Hunger Map 2019-2021.svg 2,192 × 1,135; 1.64 MB
-
 Federal subjects of Russia by HDI (2016).svg 512 × 303; 180 KB
-
 German states by HDI (2017).svg 512 × 728; 123 KB
-
 German states by HDI (2018).svg 512 × 624; 128 KB
-
 Governorates of Egypt by HDI (2017).svg 512 × 492; 245 KB
-
 Governorates of Iraq by HDI (2017).svg 512 × 513; 142 KB
-
 Hispanophone global world map language.svg 512 × 282; 837 KB
-
 Hunger Map 2020 World Food Programme.svg 2,192 × 1,135; 1.62 MB
-
 Hunger Map 2021 World Food Programme.svg 2,192 × 1,135; 1.62 MB
-
 IMF advanced economies and UN least developed countries.svg 2,192 × 1,135; 1.64 MB
-
 Indian states and territories by HDI (2017).svg 512 × 612; 203 KB
-
 Indonesian provinces by HDI (2019).svg 512 × 213; 347 KB
-
 Iranian provinces by HDI (2017).svg 512 × 490; 134 KB
-
 Japanese prefectures by HDI (2017).svg 512 × 547; 311 KB
-
 Köppen World Map Af.svg 3,000 × 1,502; 4.63 MB
-
 Köppen World Map Am.svg 3,000 × 1,499; 4.63 MB
-
 Köppen World Map Aw.svg 3,000 × 1,490; 4.63 MB
-
 Köppen World Map BS.svg 3,000 × 1,493; 4.63 MB
-
 Köppen World Map BW.svg 3,000 × 1,490; 4.63 MB
-
 Köppen World Map Cfa and Cwa (Humid subtropical).svg 3,000 × 1,490; 4.63 MB
-
 Köppen World Map Cfb, Cfc, Cwb and Cwc (Oceanic).svg 3,000 × 1,487; 4.63 MB
-
 Köppen World Map Cs.svg 3,000 × 1,481; 4.63 MB
-
 Köppen World Map Cwb and Cfb (Highland).svg 3,000 × 1,602; 4.63 MB
-

-
 Köppen World Map Dsa, Dwa and Dfa (Hot summer continental).svg 3,000 × 1,493; 4.63 MB
-
 Köppen World Map Dsa, Dwa, Dfa, Dsb, Dwb and Dfb (Humid continental).svg 512 × 256; 3.09 MB
-
 Köppen World Map Dsb, Dwb and Dfb (Warm summer continental).svg 3,000 × 1,502; 4.63 MB
-
 Köppen World Map Dsc, Dwc, Dfc, Dsd, Dwd and Dfd (Subarctic).svg 3,000 × 1,490; 4.63 MB
-
 Köppen World Map EF (Ice cap).svg 3,000 × 1,499; 4.63 MB
-
 Köppen World Map ET (Tundra).svg 3,000 × 1,487; 4.63 MB
-
 Köppen World Map ET and EF (Polar).svg 512 × 253; 3.09 MB
-
 Map of countries by Corruption Perceptions Index (2021).svg 2,192 × 1,135; 1.63 MB
-
 Map of countries by EF English Proficiency Index (2021).svg 2,192 × 1,135; 1.62 MB
-
 Map of countries by GDP (nominal) per capita in 2021.svg 2,192 × 1,135; 1.62 MB
-
 Map of countries by GDP (nominal) per capita in 2022.svg 2,192 × 1,135; 2.18 MB
-
 Map of countries by GDP (nominal) per capita in 2023.svg 2,192 × 1,135; 1.64 MB
-
 Map of countries by GDP (PPP) per capita in 2021.svg 2,192 × 1,135; 1.62 MB
-
 Map of countries by GDP (PPP) per capita in 2022.svg 2,192 × 1,135; 1.64 MB
-
 Map of countries by GDP (PPP) per capita in 2023.svg 2,192 × 1,135; 1.64 MB
-
 Map of countries by GINI coefficient (1990 to 2020).svg 2,192 × 1,135; 1.63 MB
-
 Map of countries by Global Peace Index (2021).svg 2,192 × 1,135; 1.62 MB
-
 Map of countries by Global Peace Index (2022).svg 2,192 × 1,135; 1.64 MB
-
 Map of countries by Index of Economic Freedom (2023).svg 2,192 × 1,135; 1.64 MB
-
 Map of countries by intentional homicide rate (2006 – 2018).svg 2,192 × 1,135; 1.64 MB
-
 Map of countries by suicide rate, WHO (2019).svg 2,192 × 1,135; 1.63 MB
-
 Map of European countries by GDP (PPP) per capita in 2021.svg 440 × 319; 671 KB
-
 Map of Ontario Toronto (highlighted).svg 340 × 330; 52 KB
-
 Map of the Brazilian regions by literacy rate (2019).svg 512 × 512; 172 KB
-
 Map of the Brazilian states by literacy rate (2019).svg 512 × 512; 157 KB
-

-
 Map of the megadiverse countries.svg 2,192 × 1,135; 1.64 MB
-
 Map of the Portuguese language in the world (SVG).svg 512 × 243; 799 KB
-
 Map of the U.S. states by Human Development Index (2018).svg 512 × 354; 81 KB
-
 Map of U.S. states by American Human Development Index 2016.svg 959 × 650; 113 KB
-
 Map of U.S. states by Human Development Index (2017).svg 512 × 350; 85 KB
-
 Map of U.S. states by Human Development Index 2015.svg 957 × 663; 113 KB
-
 Mapa das regiões brasileiras por PIB em 2020.svg 767 × 763; 188 KB
-
 Mapa das regiões brasileiras por renda per capita (2022).svg 780 × 758; 198 KB
-
 Mapa das regiões portuguesas por PIB.svg 721 × 1,122; 155 KB
-
 Mapa do IDH da Bahia (2010).svg 512 × 571; 506 KB
-
 Mapa do IDH da Paraíba (2010).svg 512 × 344; 186 KB
-
 Mapa do IDH de Alagoas (2010).svg 512 × 304; 108 KB
-
 Mapa do IDH de Goiás (2010).svg 512 × 528; 512 KB
-
 Mapa do IDH de Mato Grosso (2010).svg 512 × 519; 584 KB
-
 Mapa do IDH de Mato Grosso do Sul (2010).svg 512 × 519; 331 KB
-
 Mapa do IDH de Minas Gerais (2010).svg 512 × 423; 1.21 MB
-
 Mapa do IDH de Pernambuco (2010).svg 512 × 189; 154 KB
-
 Mapa do IDH de Rondônia (2010).svg 512 × 451; 234 KB
-
 Mapa do IDH de Roraima (2010).svg 512 × 645; 125 KB
-
 Mapa do IDH de Santa Catarina (2010).svg 512 × 361; 398 KB
-
 Mapa do IDH de Sergipe (2010).svg 512 × 605; 112 KB
-
 Mapa do IDH de São Paulo (2010).svg 512 × 328; 645 KB
-
 Mapa do IDH do Acre (2010).svg 512 × 303; 137 KB
-
 Mapa do IDH do Amapá (2010).svg 512 × 612; 125 KB
-
 Mapa do IDH do Amazonas (2010).svg 512 × 384; 389 KB
-
 Mapa do IDH do Ceará (2010).svg 512 × 656; 252 KB
-
 Mapa do IDH do Distrito Federal (2010).svg 512 × 343; 239 KB
-
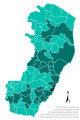 Mapa do IDH do Espírito Santo (2010).svg 512 × 768; 166 KB
-
 Mapa do IDH do Maranhão (2010).svg 512 × 686; 384 KB
-
 Mapa do IDH do Paraná (2010).svg 512 × 352; 610 KB
-
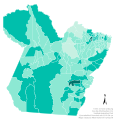 Mapa do IDH do Pará (2010).svg 512 × 537; 517 KB
-
 Mapa do IDH do Piauí (2010).svg 512 × 725; 225 KB
-
 Mapa do IDH do Rio de Janeiro (2010).svg 512 × 375; 200 KB
-
 Mapa do IDH do Rio Grande do Norte (2010).svg 512 × 335; 142 KB
-
 Mapa do IDH do Rio Grande do Sul (2010).svg 512 × 518; 638 KB
-
 Mapa do IDH do Tocantins (2010).svg 512 × 794; 368 KB
-
 Mapa dos estados brasileiros por avanço do IDH (1991-2021).svg 775 × 758; 205 KB
-
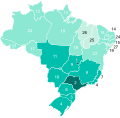
 Mapa dos estados brasileiros por IDH (1991).svg 775 × 758; 205 KB
-
 Mapa dos estados brasileiros por IDH (2000).svg 775 × 758; 205 KB
-
 Mapa dos estados brasileiros por IDH (2010).svg 775 × 758; 205 KB
-
 Mapa dos estados brasileiros por IDH (2021).svg 775 × 758; 205 KB
-
 Mapa dos estados brasileiros por população (2022).svg 775 × 758; 204 KB
-
 Mapa dos estados brasileiros por renda per capita (2022).svg 780 × 758; 205 KB
-
 Mexican states by HDI (2012).svg 512 × 369; 154 KB
-
 Mexican states by HDI (2019).svg 512 × 350; 150 KB
-
 Origin of the European and Arab immigrants in Brazil.svg 680 × 520; 622 KB
-
 Peruvian departments by HDI (2017).svg 512 × 728; 89 KB
-
 Polish voivodeships by HDI (2017).svg 512 × 512; 92 KB
-
 Portugueselanguagedialects-Brazil (colored).svg 512 × 530; 30 KB
-
 Poverty in Canadian Provinces.svg 512 × 481; 61 KB
-
 Provinces of Argentina by HDI (2016).svg 512 × 1,251; 246 KB
-
 Provinces of Argentina by HDI (2021).svg 512 × 1,251; 224 KB
-
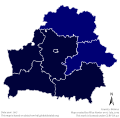 Regions of Belarus by HDI (2017).svg 512 × 503; 183 KB
-
 Regions of Chile by HDI (2017).svg 512 × 1,889; 534 KB
-
 Regions of Denmark by HDI (2017).svg 512 × 633; 135 KB
-
 Regions of Finland by HDI (2017).svg 512 × 902; 106 KB
-
 Regions of France by HDI (2017).svg 512 × 524; 104 KB
-
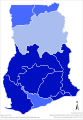 Regions of Ghana by HDI (2017).svg 512 × 735; 132 KB
-
 Regions of Hungary by HDI (2017).svg 512 × 333; 121 KB
-
 Regions of Ireland by HDI (2017).svg 512 × 676; 409 KB
-
 Regions of Italy by HDI (2017).svg 512 × 629; 236 KB
-
 Regions of Kazakhstan by HDI (2018).svg 512 × 306; 208 KB
-
 Regions of New Zealand by HDI (2017).svg 512 × 705; 224 KB
-
 Regions of Norway by HDI (2017).svg 512 × 557; 76 KB
-
 Regions of Portugal by HDI (2017).svg 512 × 885; 207 KB
-
 Regions of Portugal by HDI (2019).svg 512 × 885; 501 KB
-
 Regions of South Korea by HDI (2017).svg 512 × 792; 287 KB
-
 Regions of Sweden by HDI (2017).svg 512 × 1,192; 105 KB
-
 Regions of Switzerland by HDI (2018).svg 512 × 347; 169 KB
-
 Regions of the United Kingdom by HDI (2017).svg 512 × 909; 1.18 MB
-
 Regions of Turkey by HDI (2017).svg 512 × 263; 275 KB
-
 Regions of Turkey by HDI (2018).svg 512 × 263; 271 KB
-
 Regions of Ukraine by HDI (2017).svg 512 × 352; 494 KB
-
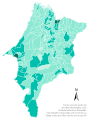
 Região Intermediária de Ji-Paraná, Rondônia.svg 512 × 429; 106 KB
-
 Região Intermediária de Porto Velho, Rondônia.svg 512 × 429; 101 KB
-
 Regiões de Portugal por PIB (2021).svg 512 × 885; 216 KB
-
 Regiões Geográficas do Estado de Rondônia.svg 512 × 429; 151 KB
-
 RSK and Yugoslav Army-held areas in Croatia in early 1992.svg 512 × 496; 233 KB
-
 South African provinces by HDI (2017).svg 512 × 453; 273 KB
-
 Spanish autonomous communities by HDI (2017).svg 512 × 431; 216 KB
-
 Uruguayan departments by HDI (2017).svg 512 × 589; 90 KB
-
 Uruguayan departments by HDI (2021).svg 512 × 589; 444 KB
-
 Venezuelan states by HDI (2017).svg 512 × 447; 90 KB
-
 Western world and culture.svg 2,571 × 1,323; 1.2 MB
.svg)

.svg)

.svg)

.svg)
.svg)

.svg)
.svg)
.svg)
.svg)
.svg)
.svg)
.svg)
.svg)
.svg)
.svg)
.svg)
.svg)
.svg)

_with_Yellowknife_and_Saskatoon.svg)
.svg)
.svg)
.svg)
.svg)
.svg)
.svg)
.svg)
.svg)

.svg)
.svg)
.svg)
.svg)
.svg)
.svg)
.svg)
.svg)
.svg)
.svg)
.svg)
.svg)
.svg)
.svg)

.svg)
.svg)
.svg)
.svg)
.svg)


.svg)
.svg)
.svg)
.svg)


.svg)
.svg)

.svg)
.svg)
.svg)
.svg)
.svg)
.svg)
.svg)
.svg)
.svg)
.svg)
.svg)
_per_capita_in_2021.svg)
_per_capita_in_2022.svg)
_per_capita_in_2023.svg)
_per_capita_in_2021.svg)
_per_capita_in_2022.svg)
_per_capita_in_2023.svg)
.svg)
.svg)
.svg)
.svg)
.svg)
.svg)
_per_capita_in_2021.svg)
.svg)
.svg)
.svg)
.svg)

.svg)
.svg)

.svg)


.svg)

.svg)
.svg)
.svg)
.svg)
.svg)
.svg)
.svg)
.svg)
.svg)
.svg)
.svg)
.svg)
.svg)
.svg)
.svg)
.svg)
.svg)
.svg)
.svg)
.svg)
.svg)
.svg)
.svg)
.svg)
.svg)
.svg)
.svg)
.svg)
.svg)
.svg)
.svg)
.svg)
.svg)
.svg)
.svg)

.svg)
.svg)
.svg)

.svg)
.svg)
.svg)
.svg)
.svg)
.svg)
.svg)
.svg)
.svg)
.svg)
.svg)
.svg)
.svg)
.svg)
.svg)
.svg)
.svg)
.svg)
.svg)
.svg)


.svg)


.svg)
.svg)
.svg)
.svg)
.svg)

.svg)
.svg)
.svg)
.svg)
.svg)